
Estimating UK investment in intangible
assets and Intellectual Property Rights
Research commissioned by the Intellectual Property Office, and carried out by:
Peter Goodridge, Jonathan Haskel, Gavin Wallis
This is an independent report commissioned by the Intellectual Property Office (IPO). Findings and opinions are
those of the researchers, not necessarily the views of the IPO or the Government.
© Crown copyright 2014
2014/36
Intellectual Property Office is an operating name of the Patent Office

'
Contacts: Jonathan Haskel and Peter Goodridge, Imperial College Business
School, Imperial College, London. SW7 2AZ. j.haskel@ic.ac.uk, p.goodridge10@
ic.ac.uk. We are very grateful for financial support for this research from NESTA
and the UK Intellectual Property Office. This work was based on data from the
Annual Survey of Hours and Earnings (ASHE), National Employers Skills Survey
(NESS) and UK Innovation Survey (UKIS), produced by the Office for National
Statistics and supplied by the Secure Data Service at the UK Data Archive. The
data are Crown Copyright and reproduced with the permission of the controller
of HMSO and Queen s Printer for Scotland. The use of the data in this work does
not imply the endorsement of the ONS or Secure Data Service at the UK Data
Archive in relation to the interpretation or analysis of the data. This work uses
research datasets which may not exactly reproduce National Statistics
aggregates. We thank Tony Clayton of the IPO for very helpful suggestions.
Views expressed in this paper represent those of the authors and do not
necessarily reflect those of affiliated institutions. All errors are of course our own.
ISBN: 978-1-910790-03-8
Estimating UK investment in intangible assets and
Intellectual Property Rights
Published by The Intellectual Property Office
30
th
September 2014
1 2 3 4 5 6 7 8 9 10
© Crown Copyright 2014
You may re-use this information (excluding logos)
free of charge in any format or medium, under the
terms of the Open Government Licence. To view
this licence, visit http://www.nationalarchives.gov.
uk/doc/open-government-licence/
or email: [email protected].uk
Where we have identified any third party copyright
information you will need to obtain permission from
the copyright holders concerned.
Any enquiries regarding this publication should be
sent to:
The Intellectual Property Office
Concept House
Cardiff Road
Newport
NP10 8QQ
Tel: 0300 300 2000
Fax: 01633 817 777
e-mail: [email protected].uk
This publication is available from our website at
www.ipo.gov.uk

Estimating UK investment in intangible assets and Intellectual Property Rights
3
Abstract
This report represents an update on the estimates of UK Intangible investment we published at
the end of March 2014. These revisions have been driven by methodological improvements
centered on improved estimates of investment in human capital.
The report contains updated estimates of (a) the level of UK market sector investment in
knowledge assets and (b) the proportions of those investments protected by Intellectual Property
Rights (IPRs). Estimates for knowledge investment are produced as part of the UK Innovation
Index. Our main findings are: 1) In 2011 the UK market sector invested £126.8bn in knowledge
assets, compared to £88bn in tangible assets; 2) Since the recession of 2008-9, intangible
investment has recovered and grew in 2010-11. In contrast investment in tangible assets has
fallen; 3) In 2011, 50% (£63.5bn) of knowledge investment in the UK market sector was
protected by IPRs 4) The majority of IPR investment is on assets protected by copyright (47%),
trademarks (22%) and unregistered design rights (18%).
1. Introduction
This report builds on previous work which estimated UK market sector investment in knowledge
capital (Goodridge, Haskel and Wallis (2012)) and the proportions of those investments protected
by formal intellectual property rights (IPRs) (Farooqui, Goodridge and Haskel (2011)). Investment
in knowledge, or intangible, capital adds to the stock of intellectual property (IP) in the economy.
Not all of that investment is protected by formal Intellectual Property Rights (IPRs) such as
copyright and patents: investments in software are protected, but investments in workforce
training are not. Thus this report attempts to answer the following questions: (a) how much
does the UK invest in knowledge assets? and (b) what proportion of UK knowledge investment
is protected by formal IPRs?
To answer these questions we first estimate UK market sector
1
investment in knowledge or
intangible assets, using the comprehensive framework outlined in Corrado, Hulten et al. (2005),
hereafter CHS. Second, we apportion various knowledge investments to investments in IPRs.
Improvements to the data and methodologies used to estimate investment in artistic originals in
the national accounts, based on our previous work (Goodridge and Haskel 2011; Goodridge,
Haskel et al. 2012), means that, when combined with official UK software investment data
(Chamberlin, Clayton et al. 2007), we can offer a better estimate for UK investment in copyright-
protected assets. As well as other categories of knowledge assets, our dataset includes
estimates of investment in research and development (‘R&D’), ‘Branding’ (made up of
‘Advertising’ and ‘Market Research’) and ‘Architectural and Engineering Design’ (AED), upon
which we base our estimates for investment in ‘Patents’, ‘Trademarks’ and ‘Design Rights’
(both registered and unregistered). Of course, not all such investment is protected by IPRs, so
We define the market sector as sections A-K, MN, & RST according to the 2007 Standard Industrial Classification,
thereby excluding Real Estate Activities (L), Public Administration & Defence (O), Education (P) and Health and
Social Work (Q).
1

4
Estimating UK investment in intangible assets and Intellectual Property Rights
we use data from the Community Innovation Survey (CIS) to estimate the proportion that is
protected. W
e estimate that: 38% of R&D is protected by patents and 3% by design registration;
and 11% of AED is protected by design registration and 2% by patents.
It is worth noting that our estimates of IPR-protected investment are not measures of all UK
spend on IPRs. Rather they are measures of all long-lived spending on creating knowledge
assets, which contribute to the production of output over a period of greater than one year, and
which is protected by formal IP mechanisms.
Our main findings are as follows:
1. In 2011, we estimate that the UK invested £126.8bn in intangible assets compared to
£88bn in tangible assets;
2. Since the recession of 2008-9, intangible investment has recovered and grew in 2010-11.
In contrast investment in tangible assets has fallen;
3. In 2011, we estimate that approximately 50% of UK market sector investment in knowledge
was protected by formal IPRs;
4. Of that investment in IPRs in 2011, we estimate that: 10% was in assets protected by
patents; 47% in assets protected by copyright; 3% in assets protected by design registration;
22% in assets protected trademark; and 18% in assets protected by unregistered design
rights.
This report proceeds as follows. In section 2 we set out our conceptual framework. In section
3 we discuss our methods for measurement in the context of that framework and present our
estimates for UK market sector investment in intangible assets. In section 4 we present our
method and results on: the proportions of UK intangible investment protected by IPRs; and
therefore our estimates of investment in IPR-protected assets. Section 5 concludes.

Estimating UK investment in intangible assets and Intellectual Property Rights
5
2. Conceptual Upstream-
Downstream Framework
The following section is a summary of the appropriate conceptual framework to consider
production of, investment in, and consumption of, intellectual property. It is based on the concept
of ‘upstream’ and ‘downstream’ sectors, as applied in Corrado, Goodridge and Haskel (2011),
where the upstream creates original IP assets and the downstream uses the IP to generate final
output. For example, the upstream could produce film originals which are used by downstream
cinema projectors or television broadcasters, or in the production and distribution of copies, in
the generation of final output. Alternatively the upstream could consist of an R&D (or design) unit
that produces commercial knowledge to be used in the downstream operations sector. This
upstream-downstream framework can be applied to any form of long-lived knowledge that is
used in the generation of final output.
Consider then an economy with an innovation (IP-producing) sector and a final output (IP-using)
sector. The innovation sector (upstream) produces long-lasting knowledge assets which
contribute to production in the final output (downstream) sector. In this economy we may write
N
the value of gross output in the innovation sector as
PN
. This is equal to factor and intermediate
costs in the sector multiplied by any mark-up () over those costs, where represents the
monopoly power earned by the innovator through the ownership of a unique knowledge asset,
which may be formally protected by IPRs:
N LN KNMNRN
P N =
µ
(PL + P K + P M + PR )
(1)
LN
K N
M N
R N
Where:
PL
,
PK
and
PM
are payments for labour, capital and intermediates.
PR
are payments for intangible capital services, for instance royalty payments to use music in the
production of a film original.
Consider next the final output or downstream sector, which uses the innovative good. They could
N
purchase the asset rights (or some component of them) outright, for a cost
PN
(or some
N
R
proportion of
PN
). Alternatively they could rent the good by paying a licence fee,
PR
, for T
years to the innovation sector. Capital market equilibrium implies that:
T
R
N
PR
t
PN=
∑
t
=1
( )
1 r
(2)
t
+
Where R is the stock of knowledge from which they rent; using the perpetual inventory method
(PIM) this might be represented by:
t
= N
t
(1
δ
) R
t−1
(3)
R +−
R

6
Estimating UK investment in intangible assets and Intellectual Property Rights
= PnN
= ΣPxX(N)
+
PrR(N)
= PyY
= ΣPxX(Y)
+
PrR(Y)
"Film Industry"
Note to Figure: To make the symmetry clear, a term for μ could also be included in the dow nstream. We assume that the dow nstream is
competitive, so μ=1, alw ays. Monopoly pow er does how ever exist in the upstream, due to the the ow nership of rights to a unique asset. So in the
upstream, μ>1.
Memo: PnN = Σ PrR / (1+r)t
Upstream Payments for rental of artistic originals
Costs of Labour, Capital & Intermediates in dow nstream
Dow nstream Payments for rental of artistic originals
e.g. Cinemas
Downstream:
Sales (Gross Output)
Upstream:
Creation of artistic original
e.g. Movie Production
plus
PnN = μ [ ΣPx(N)X(N) + PrR(N) ]
plus
Use of artistic original
Sales (Gross Output)
Costs of Labour, Capital & Intermediates in upstream
PyY = ΣPx(Y)X(Y) + PrR(Y)
}
Equation (2) says that the value of the asset must equal the discounted rental payments from
the users of the good.
Y
The final output sector, which uses the long-lived knowledge asset, produces output,
PY
.
Y LY KYMYRY
PY= PL + P K + P M + P R
(4)
LY
K Y
M Y
Where
PL
,
PK
and
PM
are the payments to labour, physical capital and materials in
R Y
the using sector, and
PR
are rental payments for using the IP created in the innovation
sector. These payments could be explicit rentals, or implicit in the case where the IP is owned
by the using firm. We assume that the final output sector is competitive and so there is no
mark-up, . A similar income identity for the materials sector completes the model.
An adjusted concept of market sector value-added, that accounts for the capitalisation of
intangible capital, consists of all the factor payments to labour and (tangible and intangible)
capital, with intermediate payments excluded.
Q L K R
PQ PL PK PR
(5)
= + +
The following diagram provides a representation of the model using the example of film originals,
but can be applied to any other form of IP.
Figure 1: Theoretical Framework. Upstream and Downstream in the Movie Industry

Estimating UK investment in intangible assets and Intellectual Property Rights
7
To summarise, in this model, UK investment in IP is the production of long-lived (i.e. with a
service life of at least one year) IP assets that are owned by UK residents. Consider then the
following distinctions:
– ‘UK IP production’ is all IP production that takes places in the UK, regardless of
ownership and duration of life;
– ‘UK IP investment’ is restricted to production of IP goods with a service life of more than
one year repeatedly used in the production of output (assets), that are owned
2
by a UK
resident;
– ‘UK IP consumption’ is the use of short or long-lived IP, by firms resident in the UK,
regardless of the residency of the owner;
– ‘Consumption of UK IP’ is the use of UK-owned short or long-lived IP, in all downstream
firms worldwide (not just those resident in the UK)
– ‘UK consumption of UK IP’ is use of short or long-lived UK IP in UK downstream firms
So, using our example of a film original, a feature movie produced in the UK but owned by an
American firm would be classed as UK production but not UK investment. The projection of
that same film in a UK cinema is ‘UK IP consumption’, but not ‘consumption of UK IP’.
The above framework also highlights the weaknesses in analysing UK IP investment using
official datasets. Suppose that we wish to measure the value of a TV or radio drama production
N
(
PN
). Our framework illustrates why this is hard to do from published industry data as
classified by the Standard Industrial Classification (SIC). Consider the SIC class “Television and
Radio Activities’. This does not distinguish between the production of programmes and their
broadcast. Moreover, production and broadcasting are often both undertaken by the same
organisation. So, both upstream and downstream activities are included in this SIC class.
Thus, a measure of sales for the whole industry includes: the downstream revenues earned by
Y
the broadcaster (
PY
), whether earned from long-lived IP assets or short-lived IP goods; all UK
IP production, including short-lived news or sports programmes, and also UK production of
assets owned in the Rest of the World (e.g. a US network funding and owning the rights to a
N
programme produced in the UK); as well as UK IP investment (
PN
).
In the case of Film the relationships between funding, ownership and performance are clear. A film produced in
the UK but with US funding and ownership is a US asset. With other knowledge assets, such as say R&D, these
relationships are less clear. R&D performed in the UK with overseas funding may or may not be owned in the UK.
Further, even if ownership resides overseas, some of the acquired knowledge remains in the UK. It is not
‘forgotten’.
2

8
Estimating UK investment in intangible assets and Intellectual Property Rights
Therefore we cannot use published SIC data to identify UK IP investment. Instead, we identify
UK production of IP assets owned in the UK. Continuing with the example of TV originals, we
use data from production companies or network production arms. Such data are reported for
ITV, BBC, Channel 4 in OFCOM reports. This allows us to make an estimate based on the
upstream input costs of asset creation, as in (1). However, we have to undertake a number of
adjustments. First, to identify investment, we must subtract the costs of production of short-
lived goods such as news and sports. Second, we must deduct the costs of production for
exported products (not UK-owned) and add in the value of imports (UK-owned). Third,
converting such costs into output values requires an estimate of the mark-up, µ, the value of
which is uncertain. Alternatively, if available, measures of investment can be estimated using
R
data on the income earned by that asset class (
PR
).
3
This latter approach is taken in the
estimation of investment in literary and music originals.
3. Measurement
Our measurement approach is designed to be consistent with the UK National Accounts and
therefore with official measures of output, income (accruing to labour and capital) and expenditure
(including consumption and investment). We start by estimating investment in knowledge assets
as identified by Corrado, Hulten et al. (2005) and applied in Goodridge, Haskel and Wallis (2012)
for the UK. We then adjust the official data from the National Accounts accurately to count
spending on knowledge assets with a shelf-life of more than a year as investment rather than
consumption, in a logically coherent framework that avoids double counting.
The categories of knowledge assets in our dataset are as featured in the NESTA Innovation
Index, and discussed in greater detail below. Included are new estimates of investment in
artistic originals, which have been revised in the national accounts, with the new estimates
based on our previous work funded by the UK IPO (Goodridge and Haskel 2011; Goodridge,
Haskel et al. 2012). As well as estimates of investment in knowledge by asset, we also present
estimates of investment protected by IPRs, including splits between registered rights (patents,
trademarks, registered design rights) and unregistered rights (copyright and unregistered design
rights).
In the steady-state, the value of investment is approximately equal to the value of capital compensation. 3
Estimating UK investment in intangible assets and Intellectual Property Rights
9
Below we provide a brief description of the methodologies and sources used to estimate
expenditure and investment on UK production of knowledge goods, by asset type. For a more
extensive description please consult past work such as Goodridge, Haskel and Wallis (2012).
Following Corrado, Hulten et al. (2005) we identify three broad groups of knowledge assets: i)
Computerised information; ii) Innovative property; iii) Economic competencies. The following
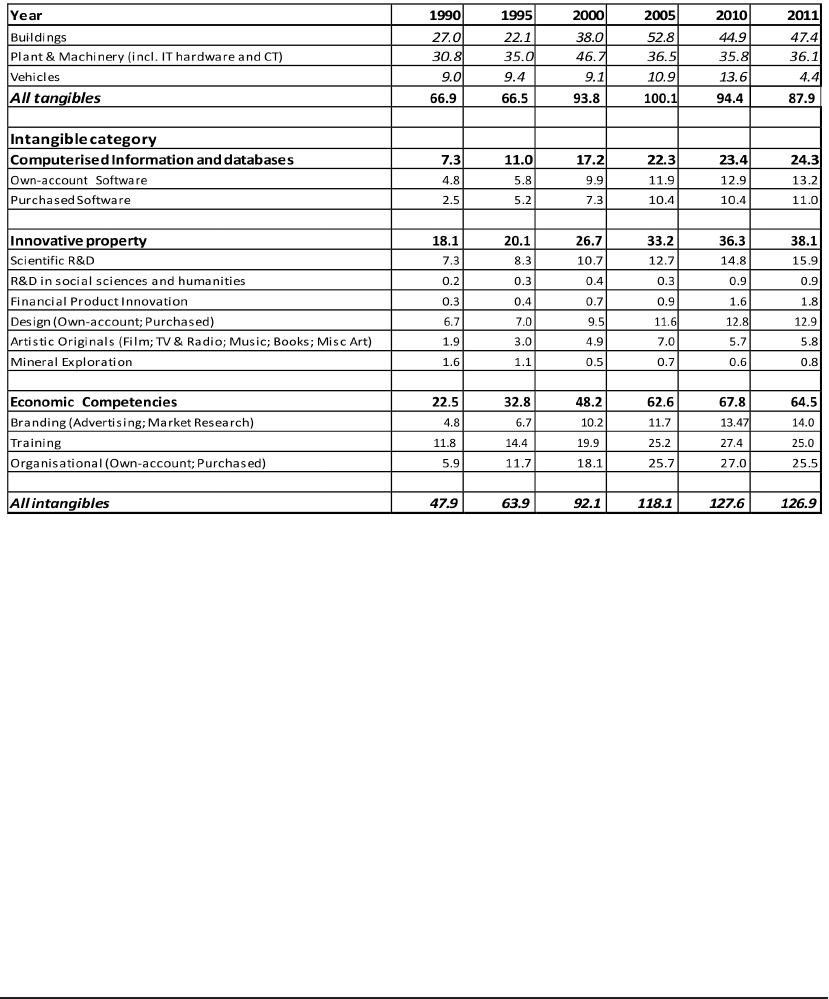
table sets out UK investment for each of these groups and the asset types within them. All
estimates presented are new to this report.
Table 1: UK Market Sector Investment; Tangible & Intangible, £bns nominal
Note to table. Data are investment figures, in £bns, current prices: italicised data are sub-totals for broader asset
definitions. MSGVA is presented with no intangibles capitalised; with only NA intangibles capitalized (software, mineral
exploration and artistic originals); and with all CHS intangibles capitalised. Market Sector refers to sectors A to K, MN,
R to U, thus excluding real estate. Estimates for intangibles are constructed as described below. Note estimates of
intangible investment do not equate to expenditure. Sub-totals might not add due to rounding. Source: ONS data for
tangibles, this paper for intangibles.
We note that these estimates for tangible investment are somewhat lower than we have
presented in the past. This is due to ONS revisions to current price investment in the 1990s and
2000s. ONS (2014) reports that overall estimates of current price GFCF for combined assets
has been revised down by about 3% on average over the period 1997 to 2010. Within that,
tangible investment has been revised down by some 15% on average over that period, while
intangible investment (referring only to intangibles already capitalised in the national accounts,
namely purchased and own-account software, artistic originals and mineral exploration) has
almost doubled in current prices. Changes to official estimates of intangible investment are due
to: a) revisions to estimates of investment in artistic originals, based on our previous work
10
Estimating UK investment in intangible assets and Intellectual Property Rights
(Goodridge and Haskel 2011; Goodridge, Haskel et al. 2012); and b) revisions to estimates of
investment in own-account software to better account for net operating surplus in own-account
K
software production (i.e. in terms of equation (1), to better account for
P K
N
).
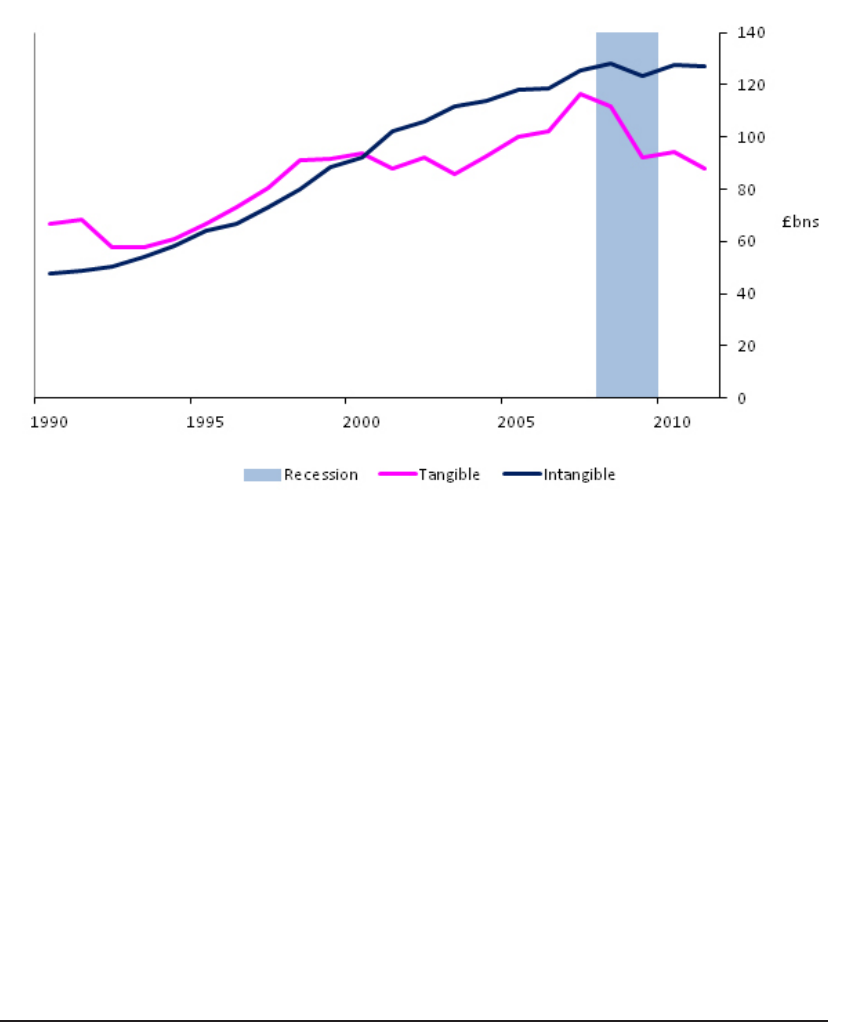
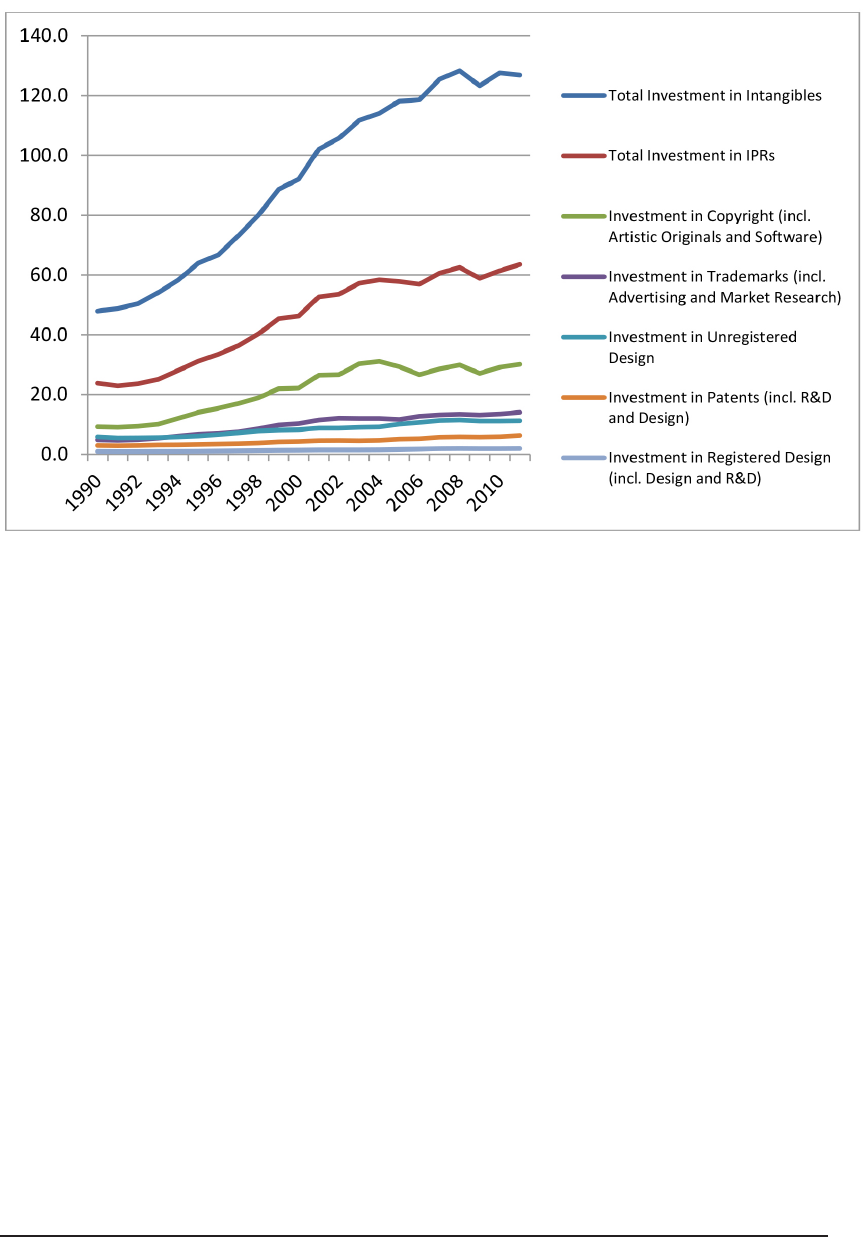
The following chart presents estimates of aggregate market sector investment in tangible and
intangible asset categories over the period 1990 to 2011. The recession is highlighted using the
blue bar.
Figure 2. UK market sector investment in tangible and intangible assets, Nominal £bns
Source: ONS for tangible (downloaded 20th January 2014), this report for intangible
There are two main points to note from this chart. First, investment in intangibles has been
consistently higher than investment in tangibles since 1999. Second, although investment in
intangibles did decline during the recession it has since recovered. Nominal intangible investment
grew at 3.5% in 2010, although slightly declined by 0.6% in 2011. In contrast, tangible investment
collapsed in 2009 and has failed to recover since. Nominal tangible investment fell by 17.7% in
2009, grew by 2.5% in 2010 and fell again by 6.9% in 2011.
On tangible investment, these are the latest ONS data and reflect recent revisions to official
estimates of UK investment. They show that, in 2011, the level of nominal tangible investment
is below its level in 2000 (£88bn in 2011 compared to £94bn in 2000). Therefore, according to
the latest data, it seems that over the longest expansion in post-war economic history, nominal
tangible investment declined. The story of the 2000s is one of a slow decline in tangible
investment between 2000 and 2004, before a rise in the mid-2000s and then a collapse in the
later recession. Detailed data indicate that the rise in the mid-2000s is driven primarily by
investment in commercial property and intangibles (i.e. those intangibles already capitalised in
the national accounts, namely software, artistic originals and mineral exploration). Nominal
investment in plant (including ICT) is recorded at a lower level in 2011 than in 1998 (£36.1bn in
Estimating UK investment in intangible assets and Intellectual Property Rights
11
2011 compared to £45bn in 1998). This reflects ONS revisions to nominal investment which
primarily consist of a downward revision to investment in plant and an upward revision to investment
in intangibles. Note that insofar as plant investment includes computers, whose price is falling,
nominal investment might fall even if quantities rise
We now go on to discuss our measurement, and estimates of investment for each asset in more
detail.
3.1 Computerised Information and databases
As Figure 3 shows, software investment in 2011 was considerable at approximately £24bn,
comfortably exceeding Scientific R&D and also a broader definition of R&D that encompasses
R&D in social sciences and financial product innovation. Total Software investment comprises
both purchased and own-account
4
, and also computerised databases. Software is already
capitalised in the National Accounts, and so our source for computer software investment is
contained in the ONS work described by Chamberlin, Clayton et al. (2007). Purchased software
data are based on company investment surveys and own-account based on the wage bill of
employees in computer software occupations, adjusted downwards for the fraction of time spent
on creating new software (as opposed to, say routine maintenance) and then upwards for
associated overhead costs (a method we use for design below). The data, which run from 1997
to 2011, are updated data provided by ONS. The data are backcast further using previous
estimates of market sector software investment as reported in Goodridge, Haskel et al. (2012).
Estimates are presented below. We assume that 100% of investment in this asset category is
protected by copyright.
Figure 3. Software: UK Investment, Nominal £bns
0
5
10
15
20
25
30
Own-account
Software
Purchased Software
Software Investment
(UK Market Sector)
Source: ONS
Own-account software is software developed by in-house employees 4
12
Estimating UK investment in intangible assets and Intellectual Property Rights
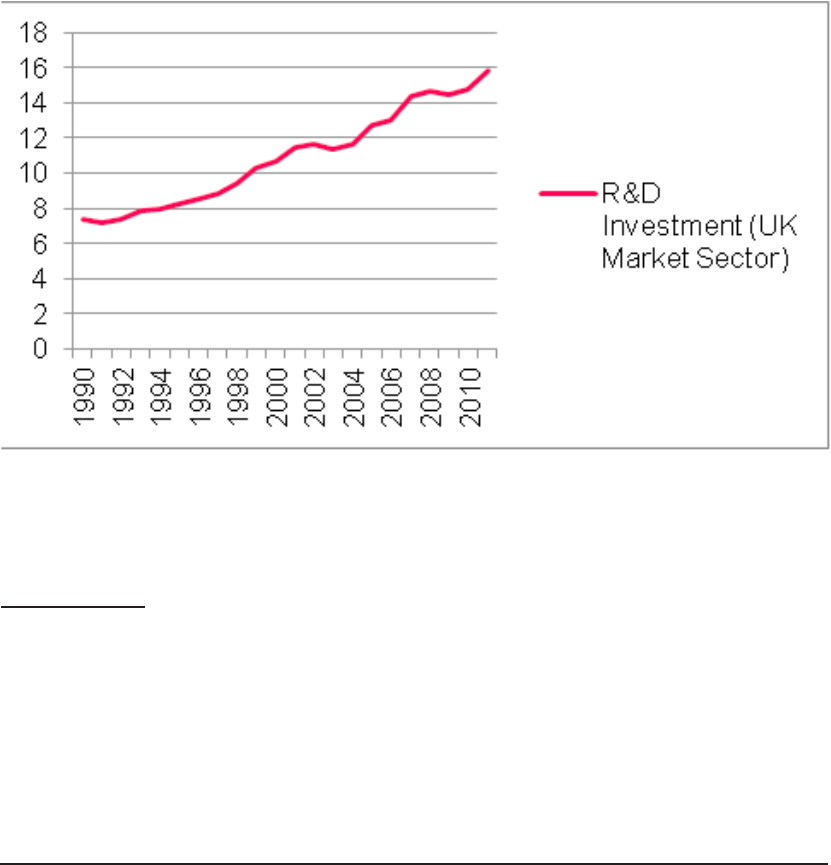
3.2 Scientific R&D
5
As shown in Figure 4, in 2011 investment in scientific R&D was approximately £16bn. For
business Scientific R&D we use expenditure data by industry derived from the Business
Enterprise R&D survey (BERD), which provides data back to 1981. To avoid double counting of
R&D and software investment, we subtract R&D spending in “computer and related activities”
(SIC 72) from R&D spending since this is already included in the software investment data. R&D
that takes place in R&D products is assumed to take place in the R&D services industry, and
that spend is allocated out using data on shares of R&D purchases in the Supply Use tables.
6
Since BERD also includes physical capital investments we convert those investments into a
capital compensation term, using the resulting physical capital stocks for the R&D sector and
the user cost relation
7
. Below we estimate that 38% of this investment is protected by patents
and 3% by registered design rights.
Figure 4. Scientific R&D: UK Investment, Nominal £bns
Source: ONS, BERD
5 Scientific R&D was capitalised in the 2008 revision to the System of National Accounts, and capitalisation in the
UK is due to be implemented in 2014.
6 The BERD data gives data on own-account spending. Spending is allocated to the industry within which the
product upon which firms are spending belongs. That is we assume that R&D on say, pharmaceutical products
takes place in the pharmaceutical industry. Spending on “R&D services” is allocated to business services. The
R&D services are sold to purchasing firms. We therefore allocate this spending out to the purchasing industries
using shares constructed from the supply use tables.
7 PK = PI (ρ+δ), where PK is the rental price of physical capital; PI is the asset price, ρ is the real rate of return and
δ is the depreciation rate.
Estimating UK investment in intangible assets and Intellectual Property Rights
13
3.3 R&D in social sciences and humanities
In Figure 5 the estimate for R&D in social sciences and humanities is £0.9bn in 2011. R&D in
social sciences and humanities is estimated as twice the turnover of the industry “Research and
experimental development on social sciences and humanities” (SIC07 72.2), where the doubling
is assumed to capture own-account spending. Turnover data are taken from published data for
the Annual Business Survey (ABS) and previously the Annual Business Inquiry (ABI) and are
available for 1997 to 2011. Data are backcast using turnover data published in the Service
Sector review and Business Monitor. This is a small number and we suspect there is little
marginal benefit to improving its measurement. We assume that this investment is not protected
by formal IPRs. The series for non-scientific R&D is presented below.
Figure 5. Non-Scientific R&D: UK Investment, Nominal £bns
0
0.1
0.2
0.3
0.4
0.5
0.6
0.7
0.8
0.9
1
Non-scientific R&D
Investment (UK
Market Secto r)
Source: ONS, ABS, ABI
14
Estimating UK investment in intangible assets and Intellectual Property Rights
2
1.8
1.6
1.4
1.2
Investment in
1
Financial Product
0.8
Innovation (UK
0.6
Market Secto r)
0.4
0.2
0
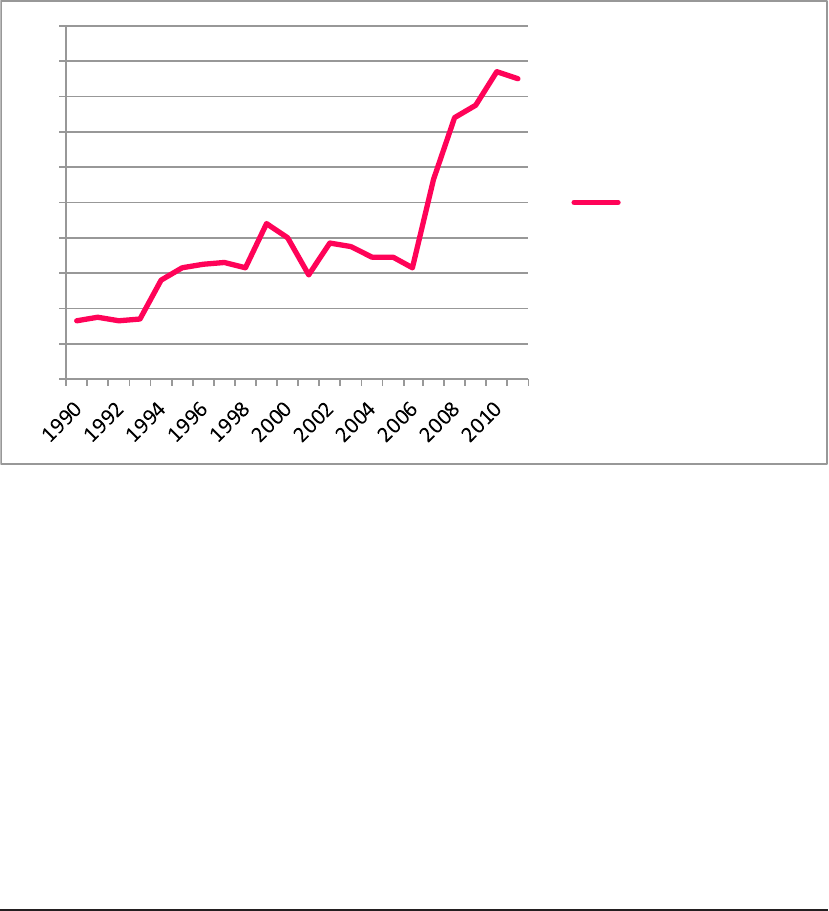
3.4 Financial Product Innovation
In Figure 6, investment in Financial Product Innovation is estimated at £1.8bn in 2011. The
measurement methodology for New products development costs in the financial industry follows
that of own account software. Further details are in Haskel and Pesole (2010) but a brief outline
is as follows. First, we interviewed a number of financial firms to try to identify the job titles of
workers who were responsible for product development. Second, we compared these titles
with the available occupational and wage data from the Annual Survey on Hours and Earnings
(ASHE). The occupational classification most aligned with the job titles was ‘economists,
statisticians and researchers’. Third, we asked our interviewees how much time was spent by
these occupations on developing new products that would last more than a year. Some firms
based their estimates on time sheets that staff filled out. Fourth, we asked firms about the
associated overhead costs with such workers. Armed with these estimates, we went to the
occupational data in the ASHE and derived a time series of earnings for those particular
occupations in financial intermediation. Own-account investment in product development is
therefore the wage bill, times a mark-up for other costs (capital, overheads etc.), times the
fraction of time those occupations spend on building long-term projects. This provides data for
1997 to 2011. Data are backcast further using the growth rate of industry turnover. We assume
that such investment is not covered by formal IP rights.
Figure 6. Financial Product Development: UK Investment, Nominal £bns
Source: Own estimates, based on ASHE

Estimating UK investment in intangible assets and Intellectual Property Rights
15
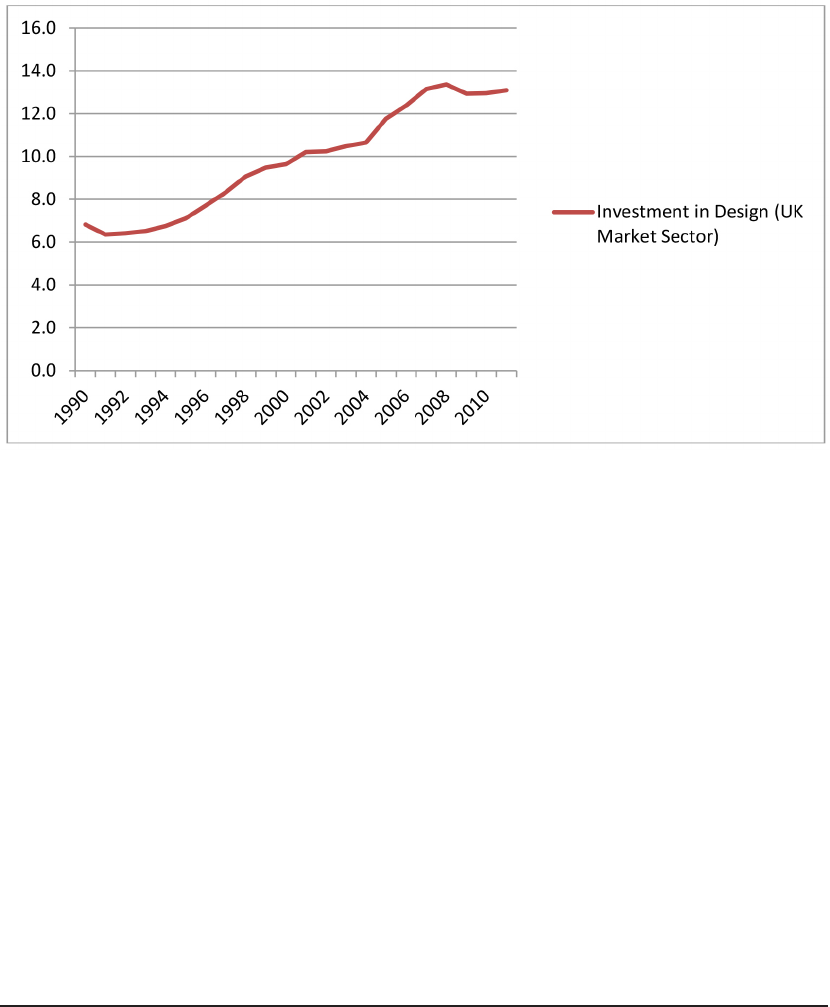
3.5 Architectural and Engineering Design
As shown in Figure 7, for 2011 we estimate investment in Design at £12.9bn in 2011. Purchased
data are taken from the Supply-Use Input Output (IO) tables. For own-account we use the own-
account software method. Full details are set out in Galindo-Rueda, Haskel et al. (2008).
In the case of purchased investments, as in Goodridge, Haskel et al. (2012), we have chosen to
exclude purchases of design by the industry itself (‘Professional, Scientific and Technical
Activities’, SIC 69t74), since some of these purchases will certainly include outsourcing and
subcontracting arrangements which would be double-counting. On own-account, the choice
of occupations and the time allocation are, as in financial services, taken from interviews with a
number of design firms. We focus on architectural, engineering and design (AED) activities,
including architects, engineers (excluding software) and general designers (graphic, product
and clothing designers). Interestingly, almost all of the design firms we interviewed have time
sheets for their employees which break out their time into administration, design and client
interaction/pitching for new business (almost all firms target, for example, that junior designers
spend little time on administration and senior more time on pitching). Thus, for professional
designers, we assigned 50% of their time to ‘long lived design’ and engineers only 10%, with
60% to the rest.
On engineers we note that here there is the potential for double-counting with R&D, since the
wages and salaries of engineers that conduct R&D will be reported in the BERD data. Not all
engineers will be involved in R&D however. This is another reason for choosing to only allocate
10% of the time of engineers to investment in design.
Further since some design expenditure/activity is short-lived rather than on the building of long-
lived assets, we further reduce the estimate by 50% to account for this. This factor is again
based on interviews conducted with design companies and the UK Design Council.
16
Estimating UK investment in intangible assets and Intellectual Property Rights
These methods provide estimates of investment for 1997 to 2011. Own-account estimates are
extended back further using data from the New Earnings Survey (NES) and purchased using
data from previous versions of the Supply Use Tables (back to 1992) and prior to that data on
the turnover of the design industry as published in the Business Monitor. Our series for UK
investment in architectural and engineering design is presented below. Of this estimate that
11% of this investment is protected by registered design rights, and 2% by patents. We assume
the remaining 87% is protected by unregistered design rights.
Figure 7. Architectural and Engineering Design: UK Investment, Nominal £bns
Source: Own estimates, based on ASHE and ONS Supply Use Tables

Estimating UK investment in intangible assets and Intellectual Property Rights
17
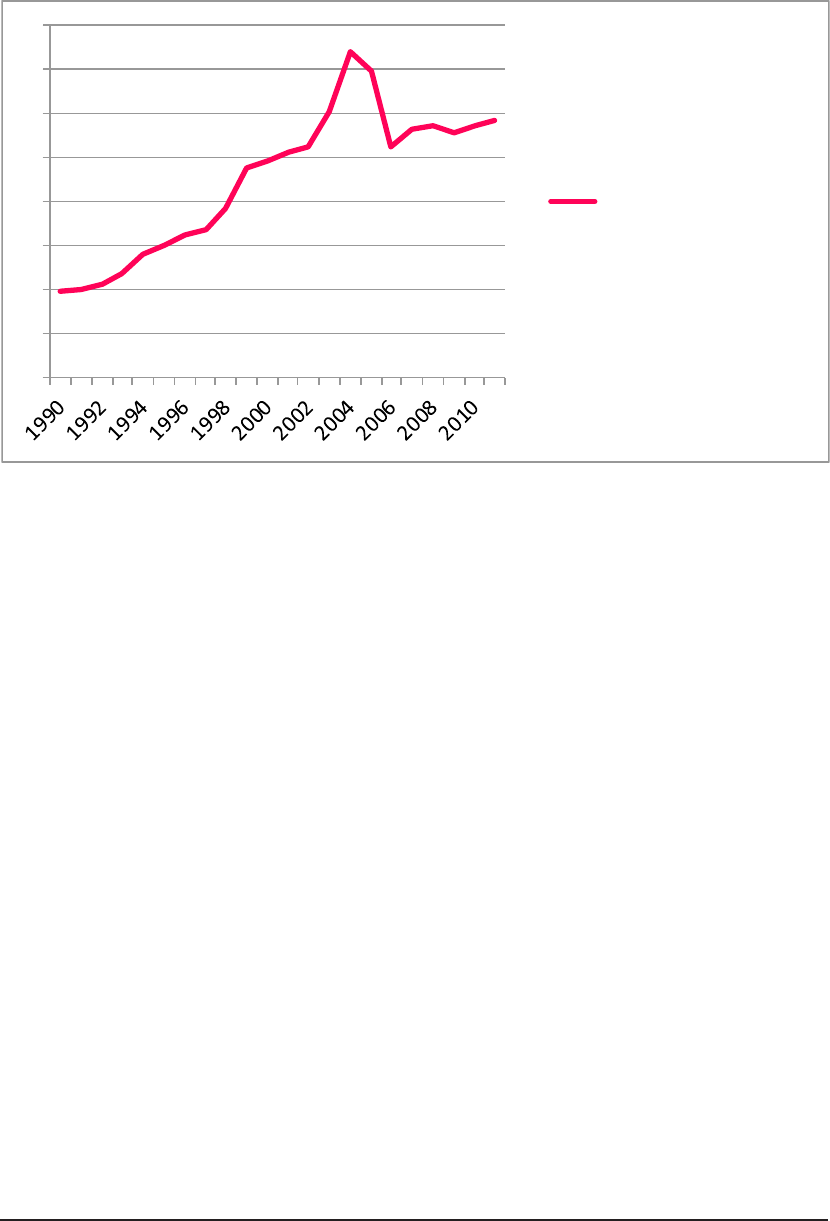
3.6 Artistic Originals
From Figure 8, in 2011 the estimate for investment in ‘Artistic Originals’ is £5.8bn. Artistic
Originals are already capitalised in the national accounts so we use those data. These estimates
are revised from past estimates, using new methods and data, based on our previous work
funded by the IPO (Goodridge and Haskel 2011; Goodridge, Haskel et al. 2012). We briefly
describe the data and methods used below. The estimates incorporate measures of UK
investment in: Film; TV & Radio; Music; Books; and Miscellaneous Art.
Estimates for investment in film originals are built bottom-up using data on budgets for UK
productions using a microdata set of all UK films produced since 1991. The dataset includes
information on co-producing partner countries and indicators on majority and minority funding.
We use such information to construct UK ownership shares for each individual film, providing us
with an estimate of investment in each UK-owned film original. Estimates for television and
radio are based on data for production costs for UK broadcasters, as published in OFCOM
Annual Reports, excluding expenditure on short-lived genres or formats such as ‘News’ or
‘Current Affairs’. Estimates for investment in literary originals are calculated using measures of
the capital compensation that flows to the owners of rights (namely publishing houses and
authors). Under the assumption of steady-state conditions, such compensation can be used
as a proxy for investment. Similarly, estimates for investment in recorded originals (music) are
also calculated using an income-based approach, with the data on income incorporating the
revenues earned by the owners of rights through recording sales, royalties distributed by the
music collecting societies, and revenues earned from live performance. For other forms of art
that meet the criteria for artistic originals (photography/images, choreographed routines, fine art
etc.), estimates are produced using data on the labour costs of relevant occupations as reported
in ASHE, and reduced by 50% to account for the possibility of such professions earning a
proportion of their income from other sources.
The official data for investment in Artistic Originals run from 1997 to 2011. We extend the
estimates back further using a combination of our own estimates (Goodridge and Haskel 2011;
Goodridge, Haskel et al. 2012) and the old national accounts estimates from prior to the revision.
The series for investment in this asset category is presented below.
8
One of the criteria for
identifying artistic originals is that they are covered by copyright. We therefore assume that
100% of investment in this asset category is protected by copyright.
We note the unusual spike in the series in the mid-2000s which we intend to investigate further. 8
18
Estimating UK investment in intangible assets and Intellectual Property Rights
Figure 8. Artistic Originals: UK Investment, Nominal £bns
0
1
2
3
4
5
6
7
8
Investment in Artistic
Originals (UK Market
Sector)
Source: ONS, based on Goodridge and Haskel (2011) and Goodridge, Haskel et al. (2012).

Estimating UK investment in intangible assets and Intellectual Property Rights
19
3.7 Mineral Exploration
As shown in Figure 9, in 2011 investment in Mineral Exploration was £0.8bn. Like computerised
information and artistic originals, mineral exploration is already capitalised in the National
Accounts and the data here are simply data for Gross Fixed Capital Formation (GFCF) from the
ONS, valued based on “payments made to contractors or costs incurred on own account. The
costs of past exploration, not yet written-off, are re-valued (which in this case may well reduce
the value). This expenditure covers the costs of drilling and related activities such as surveys. It
is included in GFCF whether or not the exploration is successful.” (ONS 1998). These data run
from 1997 to 2011. They are extended back further using data from past releases of the
national accounts.
Figure 9. Mineral Exploration: UK Investment, Nominal £bns
0
0.5
1
1.5
2
2.5
1990
1992
1994
1996
1998
2000
2002
2004
2006
2008
2010
Investment in Mineral
Exploration (UK
Market Secto r)
Source: ONS
20
Estimating UK investment in intangible assets and Intellectual Property Rights
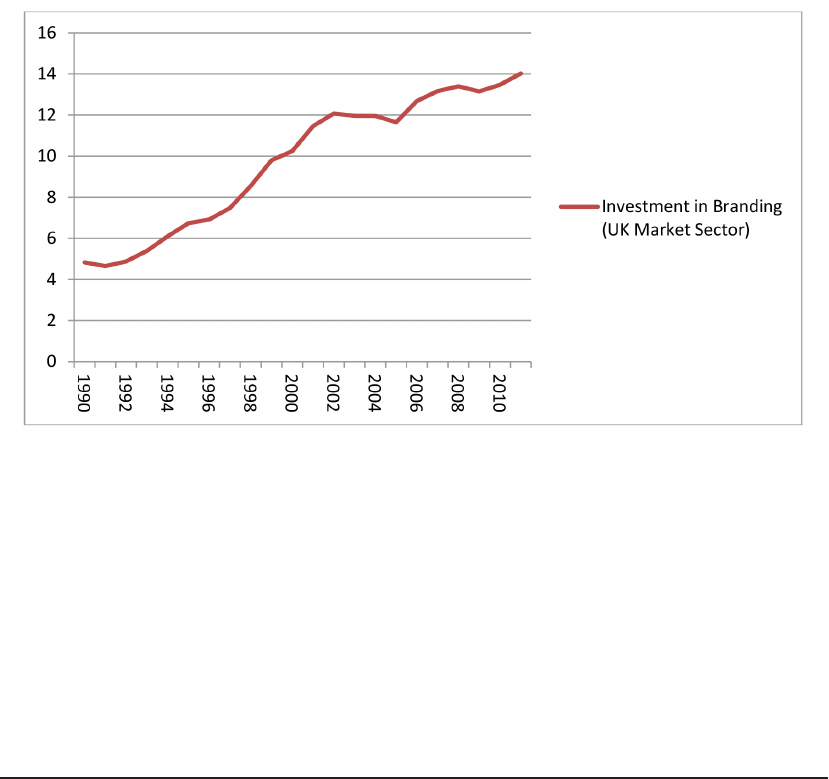
3.8 Branding: Advertising and Market Research
As shown in Figure 10, in 2011 we estimate total investment in Branding to have been around
£14bn. Of this, advertising made up £10.3bn, and market research £3.7bn. Each category is
estimated using data on purchases from the Supply Use Tables (product group 73: Advertising
and market research services) across all industries. As with design, we exclude purchases
made by the industry itself (SIC 69t74, Professional, Scientific and Technical Activities) since
some of these purchases include outsourcing and subcontracting arrangements which would
be double counting. Advertising and Market research are split using data from the ABS and
estimates for market research are further doubled to allow for own-account expenditure. As
with design, not all expenditure goes toward the building of reputational assets, since some is
short-lived. To account for this we take 60% of the expenditure estimates and assume that
proportion represents investment. These data are available from 1997 to 2011. Data are
extended back further using previous estimates constructed from past releases of the Supply
Use Tables. Our series for investment in Branding is presented on the following page.
Figure 10. Branding: UK Investment, Nominal £bns
Source: Own estimates based on ONS Supply Use Tables
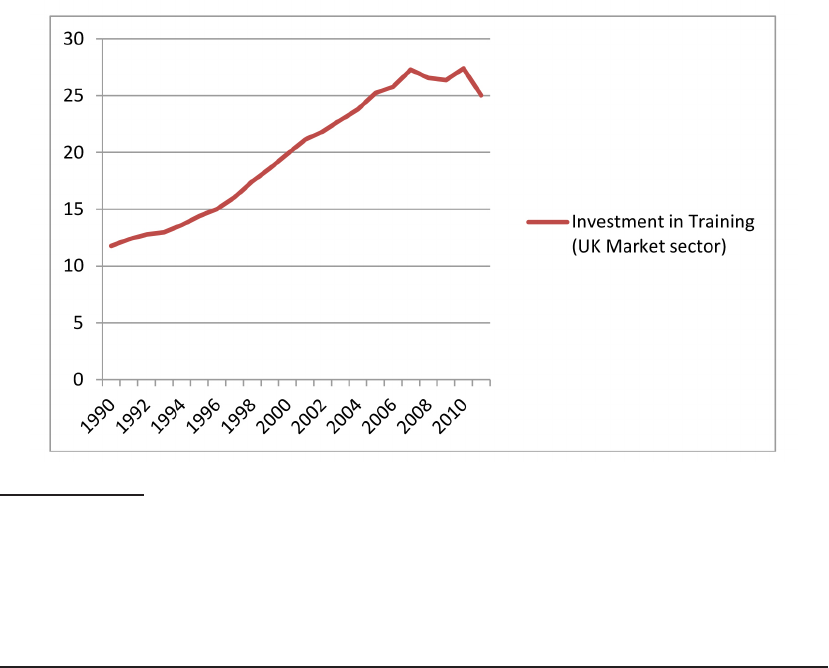
3.9 Firm-specific human capital (Training)
From Figure 11, our estimate of investment in Training is £25bn in 2011. Firm specific human
capital - training provided by firms - was estimated using cross sections from the National
Employer Skills Survey for 2007 and 2009.
Estimating UK investment in intangible assets and Intellectual Property Rights
21
In previous estimates published in January 2014
9
(Goodridge, Haskel et al. 2014a
10
; Goodridge,
Haskel et al. 2014b
11
), estimates for investment in training included expenditures on the provision
of ‘Health & Safety’ and ‘Induction’ training. In these latest estimates (from Goodridge, Haskel
et al. (2014c
12
)), and consistent with past work (see Goodridge, Haskel et al. (2012)), we use
estimates from the National Employer Skills Survey (NESS) on what proportion of training spend
is on Health and Safety and Induction training and make an adjustment on that basis.
In the production industries, Health & Safety and Induction training is estimated at between 30
and 40% of total spend. Since it seems reasonable that Health and Safety training may have
more impact on firm productivity in the production industries compared to say Business
Services, and that Induction training in production may be more likely to include training on job-
specific skills, we decided to include this component for production but exclude it in the service
sector. As a result, estimated investment in training and hence total intangibles is lower than
published in either Goodridge, Haskel et al. (2014a) or Goodridge, Haskel et al. (2014b). Whilst
this subtraction lowers the level of training spending, it turns out to have little impact on the
estimated contribution of training to growth.
We also have data for 1988 from an unpublished paper by John Barber. We thus backcast the
series using the EU KLEMS
13
wage bill time series benchmarking the data to three cross
sections, and extend the series forward with ONS compensation of employees. Our series for
investment in Training is presented on the following page.
Figure 11. Training: UK Investment, Nominal £bns
Source: Own estimates based on NESS
9
10
11
12
13
Goodridge P, J Haskel, et al (2012). – “UK innovation Index productivity and growth in UK Industries
Goodridge P, J Haskel, et al (2014a). – “Estimating UK investment in intangible assets” Preliminary report for
NESTA”
Goodridge P, J Haskel, et al (2014b). – “Estimating UK investment in intangible assets and Intellectual Property
Rights” Report for the UK Intellectual Property Office.
Goodridge P, J Haskel, et al (2014c). – “UK innovation Index 2014. “NESTA Working paper No.14/07
http://www.euklems.net/project_site.html
22
Estimating UK investment in intangible assets and Intellectual Property Rights
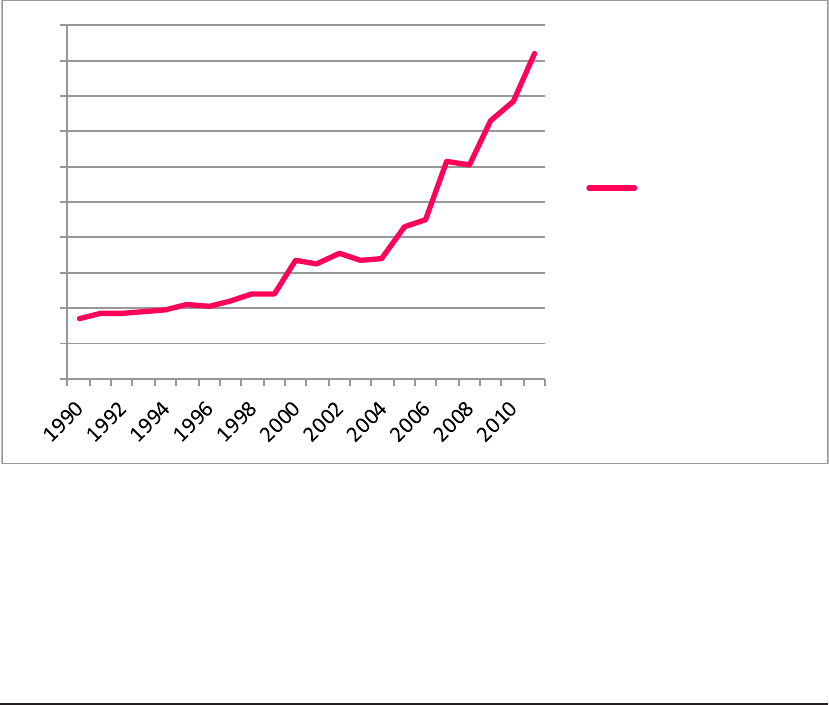
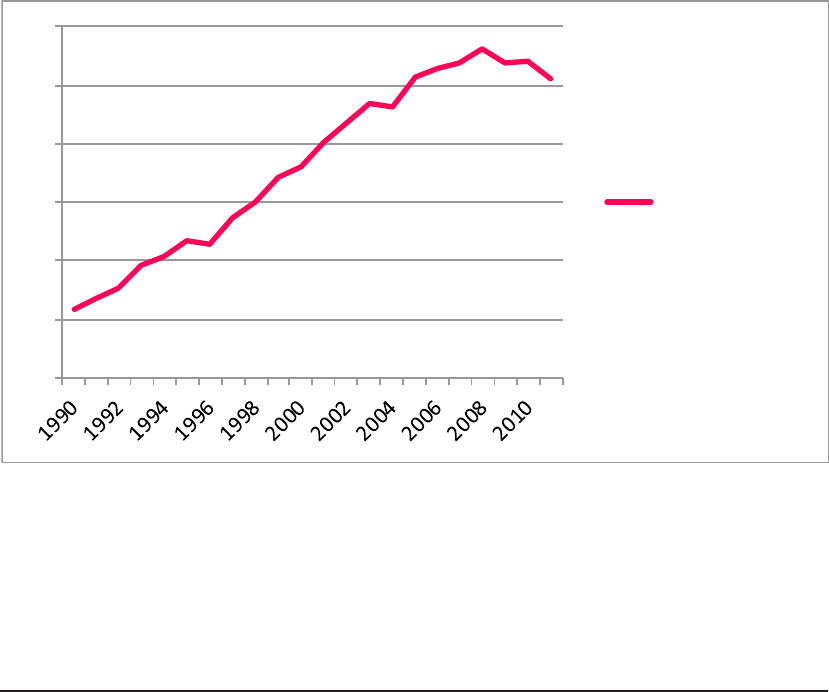
3.10 Organisational Structure
As shown in Figure 12, for 2011 we estimate investment in organisational structure at £25.5bn.
Our data on investment in organisational structure relies on purchased management consulting,
on which we have consulted the Management Consultancy Association (MCA), and own-
account time-spend, as before. On purchased, the MCA state that they represent 70% of the
industry. We therefore apply an upward adjustment to account for the remainder of the industry.
We have MCA data for the years 2002-05 and 2009-10. Estimates for other years are
interpolated and extrapolated using data on the turnover of the management consulting industry
from the ONS ABS and its predecessors. We also assume that not all purchased organisational
knowledge represents investment. Therefore 20% of purchased consultancy is removed from
the investment figure, on the basis that not all of the knowledge acquired is long-lived capital.
The method for own-account relies on identifying managers by occupation. Then using ASHE,
we take 20% of the managerial wagebill and assume that covers the own-account costs of
investments in the improvement of organisational processes.
Our own-account estimates run from 1997 to 2011. They are backcast further using data from
the NES. Our series for organisational investment is shown below. We assume that none of
these investments are protected by formal IPRs.
Figure 12. Organisational Structure: UK Investment, Nominal £bns
0
5
10
15
20
25
30
Organisational
Investment (UK
Market Secto r)
Source: Own estimates based on data from the MCA and ASHE
All the above estimates are presented at the aggregate market sector level. Appendix 1 presents
estimates of intangible investment at the industry-level.

Estimating UK investment in intangible assets and Intellectual Property Rights
23
4. Estimating the proportions
of knowledge investment
protected by IPRs
In measuring investment in assets protected by different types of IPRs, we also need to estimate
what proportion of investment is protected by IPRs. In this section we discuss our methods to
do that.
IPRs can be split into two broad groups: registered and unregistered rights. The first requires
formal application from innovators, the second are automatic and invoked by the innovator
when necessary. Table 2 summarises the IP rights considered in this report, how they fit into
each of these groups and previews our findings of what proportion of investment is protected
by IPRs (by asset type).
Table 2: Registered and Unregistered Rights; % of investment protected by IPRs
Registered
Unregistered
Design
Unregistered
% of investment
Asset \ IPR Patents Trademarks
Registration
Copyright
Design rights
protected by IPRs
Artistic Originals 0% 0% 0% 100% 0% 100%
Software 0% 0% 0% 100% 0% 100%
Branding 0% 100% 0% 0% 0% 100%
Scientific R&D 38% 0% 3% 0% 0% 41%
Design 2% 0% 11% 0% 87% 100%
Note to table: estimates for percentage protected by IPRs based on this report. Note that shares of investment
protected do not equate to shares of expenditure protected.
First consider ‘Artistic Originals’. One of the criteria set out by Eurostat for classification as an
artistic original is that it must be covered by copyright. Therefore we consider our estimates of
investment in these assets to all fall within the category of ‘investment in copyrights’. Regarding
software, since all copyrighted works are recognised automatically when asserted by the owner,
we classify all investment in software (own-account and purchased) as ‘investment in copyrights’,
alongside investment in artistic originals.
For Branding, we also estimate that 100% of our measure of investment is protected by
Trademarks. Our reasoning is as follows. We recognise that not all expenditure on advertising
and market research constitutes investment. Based on industry discussions we estimate
investment in brands as 60% of expenditure on advertising and market research. In doing so,
we effectively remove all short-lived expenditure. Since the remaining investment is by definition
long-lived, we allocate all of that to our category ‘investment in trademarks’.

24
Estimating UK investment in intangible assets and Intellectual Property Rights
The remaining forms of intangible investment that can be protected by formal IPRs are Scientific
R&D and Design, each of which can be protected by either patents or design registration. We
estimate the proportions of these assets protected by these mechanisms below, using the
Community Innovation Survey (CIS) and econometric analysis. On R&D, we estimate that 38%
of R&D is protected by patents and 3% by registered design rights. On Design, we estimate
that 11% is protected by registered design rights and 2% by patents. Since ‘unregistered
design rights’ are automatic, we allocate the remaining 87% of investment to this IPR category.
We summarise our method and results below. We note that results in the wider literature are
supportive of these findings.
4.1. Allocating IP protection to investment
To estimate the fraction of investment protected by IPRs we may proceed via a) a questionnaire
or b) an econometric approach.
a) Questionnaire
There is a small body of work that attempts to ask what type of protection methods are used by
firms. First, in US work a minority of firms report using formal IP protection methods, and
instead typically report the use of first-mover advantages, secrecy or no formal protection at all.
Cohen, Nelson et al. (2000) asked firms whether they introduced a process and/or product
innovation and which IP protection mechanism they considered effective. In a sample of 1,065
American research laboratories in manufacturing, 1991-93, patents were considered effective
in 34% of product innovations and for 23% of process innovations. Patents were considered
most effective in pharmaceuticals (50%) and medical equipment (55%).
Second, in Europe, Arundel (2001) studies the question using the 1993 CIS for innovative
manufacturing firms in Norway, Germany, Luxembourg, the Netherlands, Belgium, Denmark,
and Ireland. He presents the percentage of the 2,848 R&D performing firms who give the
highest rating to lead time, secrecy, complexity, patents and design registration. Patents score
11.2% and 7.3% for product and process innovations.
Third, Haskel and Pesole (2011) use the CIS to estimate how many firms report using design
rights. They find that 15% of firms report registering a design and that this is in line with other
studies.
Fourth, Farooqui, Goodridge and Haskel (2011) use data from the UK CIS. In a section
“Protection of Innovation” firms are asked to report the relative importance (no, low, medium
and high) of eight different protection mechanisms:
1. Design Registration
2. Trademarks
3. Patents
4. Copyright

Estimating UK investment in intangible assets and Intellectual Property Rights
25
5. Confidentiality Agreements
6. Secrecy
7. Complexity of Design
8. Lead time advantage over competitors
They found that the majority (52%) of firms report using none of these mechanisms, and those
that do use a combination of them. They also found that those who do report using such
mechanisms tend to be the largest spenders on R&D and other intangibles.
Table 2 from Farooqui, Goodridge and Haskel (2011) is reproduced below. It shows that, in
manufacturing for instance, only 31% of firms report using patents but these firms also
conducted 94% of industry expenditure on R&D and 81% of industry expenditure on Design.
Similarly, in manufacturing, only 31% of firms report using design registration but conducted
49% of design expenditure and 82% of R&D. Similar patterns exist for other industries. In
general those authors find that while attitudinal responses show a preference for informal IP
mechanisms, the R&D spending relative to sales profile is skewed towards those firms that
prefer formal IP mechanisms.
Table 3: Reported importance of IP methods, by industry
Industry Agric, Fish, Mining Manufacturing Gas Elect Water Construction
Firms R&D
spend
(£'000s)
Design
spend
(£'000s)
Firms R&D
spend
(£'000s)
Design
spend
(£'000s)
Firms R&D
spend
(£'000s)
Design
spend
(£'000s)
Firms R&D
spend
(£'000s)
Design
spend
(£'000s)
367 84209 6492 12819 4479866 760295 104 11262 910 3517 57174 99812
% % % % % % % % % % % %
Firms using Patents 17 94 81 31 94 81 15 2 91 9 71 90
Firms using
Trademarks
19 86 66 35 92 80 17 89 94 13 80 89
Firms using Design 14 89 34 31 82 49 16 1 40 11 73 34
Firms using
Copyrights
13 92 32 30 90 50 24 91 49 11 71 33
Industry Distbn, retails, hotels, restu Financial intermed Business Service Other
Firms R&D
spend
(£'000s)
Design
spend
(£'000s)
Firms R&D
spend
(£'000s)
Design
spend
(£'000s)
Firms R&D
spend
(£'000s)
Design
spend
(£'000s)
Firms R&D
spend
(£'000s)
Design
spend
(£'000s)
11245 362422 130779 1533 130314 37942 8815 2095602 310993 132 3336 239
% % % % % % % % % % % %
Firms using Patents 13 72 45 11 52 20 17 89 91 14 5 24
Firms using
Trademarks
20 70 84 20 62 50 23 85 81 21 19 25
Firms using Design 15 66 38 14 53 8 18 79 40 15 7 11
Firms using
Copyrights
15 65 25 20 66 36 25 85 49 33 26 36
Note to table. Each cell shows, by industry, the percentage of firms using each protection type and the fraction of all
spending on R&D and design in that industry that those using firms account for. Note that firms can report that they
use more than one protection type. Source: CIS.
26
Estimating UK investment in intangible assets and Intellectual Property Rights
b) Econometric estimation
To examine this for the UK, we use the fifth wave of the CIS (2004-2006). In the econometric
approach there are two preliminary issues to be dealt with. First, firms use multiple protection
methods. Second, the methods are subject to firm specific response bias. Therefore, in order
to isolate response specific variation, we compute the mean importance across all 8 mechanisms
( ), and the associated standard deviation ( ). All responses are then adjusted by the mean
and standard deviation to correct for the response bias. Let denote the score of a particular
mechanism and let denote its standardized value then:
(6)
For example, let’s say a firm reports an importance vector of (0, 1, 2, 1, 2, 2, 3, 3) for design
registration, trademarks, patents, copyright, confidentiality, secrecy, complexity and lead-time
respectively. The firm-specific mean is (0+1+2+1+2+2+3+3)/8=1.75, and the standard
deviation is 1.035. The above transformation then returns an importance of (1-1.75)/1.035 =
-0.72 for trademark and copyright, equivalently it returns an importance of (3-1.75)/1.035 =
1.2 for complexity and lead-time.
The standardization assumes that each individual response is taken from the same underlying
normal distribution. It therefore endows each individual response the same measurement unit
and amplifies the importance of those responses that are further away from the firm bias
14
. In
doing so the transformation signifies relative importance to the others.
Consider now the allocation of spend. Each firm reports R&D and other intangible spend and
the use of possible multiple methods of IP protection. Hence the question is: how do we allocate
the spend in each firm to its reported IP?
Consider R&D. How much R&D is: (a) protected by patents; and (b) protected by registered
design rights. To answer this we conduct a firm-level regression analysis that correlates the R&D
to sales ratio with the different IP types. While the regression analysis does not make any causal
assumptions, it can be regarded as a reduced form description of the sensitivity of R&D/sales
to reported use of IP. The regression takes the following form:
(7)
14 We note that this transformation (a) requires the mean for each firm of the transformed variable is 0 and (b)
transforms firm level responses to missing if there is no variation in returns i.e. all importance rankings are firm
specific but not response specific.

Estimating UK investment in intangible assets and Intellectual Property Rights
27
23
Where on the left hand side we use R&D as a % of sales. On the right hand side, the vector
ijt
X
represents firm level IP use intensity and contains standardized responses for the individual IP
mechanisms. The firm level mean and standard deviation of these responses is captured in the vector
()
ijt
X
σ
. The IP use vector can be expanded out as:
0 1 2 3
4 5 6 7
ijt
X Design Trademarks Pat ents Copyright
Confidentiality Secrecy Complexity Lead Time
αβ β β β
β β β β
= + + + +
+ + + +
(8)
Where
α
captures the R&D/Sales intensity of those firms that do not rely on any IP mechanism,
2
β
captures the elasticity of R&D intensity to patent use holding all other forms of IP use constant, and
0
β
the elasticity of R&D intensity to the use of design registration holding all other forms constant.
The
β
coefficients are not structural parameters and therefore do not represent a causal change in
demand for R&D intensity i.e. we are not saying that firms first decide on IP use and then how much
to spend on R&D. Rather, they are the reduced form correlations and can be regarded as a summary
of the various elasticities. As long as the use/importance of each IP mechanism is measured in the
same units, we can calculate the ratio
which would give the share of spending that would be
accounted for by firms using IP type i as protection, as a share of total spending by those firms using
any form of protection.
As implied by (7) we also include a number of control variables. As noted we include the firm level
mean and standard deviation of IP responses. We also include the % of employees with a degree in
science or engineering, the log of employment and industry dummies.
The R&D relationship is analysed using standard OLS. For Design, we note that questions on design
expenditure are less well answered on the CIS (Awano, Franklin, Haskel et al (2010a)). There are
also many instances where firms respond positively to the question of whether they undertake activity
but the expenditure estimate is zero or missing. Therefore we use the binary question on design
activity and so employ a probit procedure. Since the questions on R&D expenditure appear to be
better answered, we have more confidence in using the expenditure data in the case of R&D.
The results are presented below in Table 4. Column 1 presents a probit regression for design, where
the left-hand side variable is a binary yes/no response and the right hand side includes demeaned
responses for each IP protection mechanism as described above. Also included in the regression, but
Where on the left hand side we use R&D as a % of sales. On the right hand side, the vector
X
ijt
represents firm level IP use intensity and contains standardized responses for the individual IP
mechanisms. The firm level mean and standard deviation of these responses is captured in the
vector
σ
()
ijt
. The IP use vector can be expanded out as:
X
X
ijt
αβ
Design +
β
Trademarks +
β
Patents +
β
Copyright
(8)
=+
0 1 2 3
+
β
Confidentiality +
β
Secrecy +
β
Complexity +
β
Lead Time
4 5 6 7
Where
α
captures the R&D/Sales intensity of those firms that do not rely on any IP mechanism,
β
2
captures the elasticity of R&D intensity to patent use holding all other forms of IP use
constant, and
β
the elasticity of R&D intensity to the use of design registration holding all other
0
forms constant. The
β
coefficients are not structural parameters and therefore do not represent
a causal change in demand for R&D intensity i.e. we are not saying that firms first decide on IP
use and then how much to spend on R&D. Rather, they are the reduced form correlations and
can be regarded as a summary of the various elasticities. As long as the use/importance of
each IP mechanism is measured in the same units, we can calculate the ratio
7
which would
∑
=0
give the share of spending that would be accounted for by firms using IP type i as protection,
as a share of total spending by those firms using any form of protection.
As implied by (7) we also include a number of control variables. As noted we include the firm
level mean and standard deviation of IP responses. We also include the % of employees with a
degree in science or engineering, the log of employment and industry dummies.
The R&D relationship is analysed using standard OLS. For Design, we note that questions on
design expenditure are less well answered on the CIS (Awano, Franklin, Haskel et al (2010a)).
There are also many instances where firms respond positively to the question of whether they
undertake activity but the expenditure estimate is zero or missing. Therefore we use the binary
question on design activity and so employ a probit procedure. Since the questions on R&D
expenditure appear to be better answered, we have more confidence in using the expenditure
data in the case of R&D.
The results are presented below in Table 4. Column 1 presents a probit regression for design,
where the left-hand side variable is a binary yes/no response and the right hand side includes
demeaned responses for each IP protection mechanism as described above. Also included in
the regression, but not shown, are the control variables described above. Column 2 reports the
marginal effects from this regression. Column 3 presents the results of an OLS estimation,
where the left-hand side variable is R&D/Sales and the right hand side includes demeaned
responses on the importance of IP mechanisms and the control variables. In each regression,
in order to identify the idiosyncratic impact of the different mechanisms we assign one mechanism
as the reference category and constrain its impact to zero.

28
Estimating UK investment in intangible assets and Intellectual Property Rights
EQUATION VARIABLES
(1)
Design
(1/0)
(2)
Marg.
Effects of
Col (1)
(3)
R&D/Sales
design_yn Design
Trademarks
0.0549*
(0.0283)
0.0119
0.0190*
(0.00981)
0.00412
0.0368
(0.145)
Patents
(0.0263)
0.00958
(0.00910)
0.00332 0.415***
Confidentiality
Copyright
Complexity
LeadTime
(0.0294)
0.0250
(0.0297)
0.0619**
(0.0274)
0.247***
(0.0292)
0.0948***
(0.0102)
0.00867
(0.0103)
0.0214**
(0.00947)
0.0854***
(0.0101)
0.0328***
(0.146)
0.00889
(0.118)
0.160
(0.137)
0.343***
(0.122)
0.00972
SINGLE Secrecy
(0.0252) (0.00871) (0.111)
0.129
(0.1
18)
Observations 6,823 6,823 3,965
R-square
Standard errors in parentheses
*** p<0.01, ** p<0.05, * p<0.1
0.165
Sum of marginal effects: Σβi
% protected by Patents
% protected by Design rights
0.17471
1.9%
10.9%
1.10241
37.6%
3.3%
Table 4: Regression estimates of proportions of R&D and Design protected by IPRs
Note to table: Column 1 is a probit regression using a binary yes/no variable on whether firms conduct design as the
regressor. Column 2 reports the marginal effects for the regression in column 1. Column 3 reports an OLS regression
using the firm R&D/sales ratio as the regressor. Columns 1 and 3 include controls such as industry dummies, the mean
and standard deviation of responses on IP mechanisms, employment and the proportion of employees with a degree in
science or engineering.
Column 2 reports the marginal effects for the regression in Column 1. According to these
estimates, the most important IP protection mechanisms for firms conducting design are: 1)
Complexity; 2) Lead Time; 3) Copyright; 4) Design registration; in that order. We wish to
determine what proportion of design is protected by: a) registered design rights; and b) patents.
Taking the marginal effect for each of these mechanisms as the sum of all the marginal effects
we estimate that: 11% of design is protected by registered design rights; and 2% of design is
protected by patents. By assumption, the remainder of design (87%) is protected by unregistered
design rights.

Estimating UK investment in intangible assets and Intellectual Property Rights
29
Column 3 presents our results for R&D, this time using R&D intensity as the dependent variable.
The results suggest that the most important protection mechanisms for R&D are: 1) Patents; 2)
Complexity; 3) Copyright; 4) Secrecy; and 5) Design Registration. Since the coefficient on each
mechanism provides an estimate of the marginal effect, taking the coefficient on patents and
design registration as a sum of all the coefficients, we estimate that: 38% of R&D is protected by
patents; and 3% of R&D is protected by registered design rights.
One might reasonably imagine that these effects vary by industry and hence we would wish to run
separate regressions for each industry. We are however limited in our ability to conduct a similar
regression exercise for each and every industry. On the one hand, most R&D activity is limited to
specific sectors. On the other hand, the CIS survey simply does not survey enough firms in very
detailed industries of interest, such as pharmaceuticals, and we are limited in our ability to exploit
firm level variations and draw statistically meaningful conclusions. In addition, disclosure concerns
dictate a certain degree of aggregation. With these trade-offs in mind, we only conduct our analysis
at the aggregate market sector level.
Of the remaining assets not discussed in this section, such as Training and Organisational Structure,
we assume that none of these investments are protected by formal IPRs. Of course certain
licensing rights apply to activities such as Mineral Exploration, but not IPRs which are our interest
in this report.
We now apply our estimates of what proportion of investment is protected by IPRs, to our dataset.
Results are presented below in Table 5. We estimate that almost half (48% in 2011) of UK
investment in intangibles is in assets protected by formal IPRs, amounting to £65.6bn in 2011. Of
that, almost half (46% in 2011) is in assets protected by copyright, namely software and artistic
originals. Of the remainder, trademarks and unregistered design rights each account for 21%,
patents for 10%, and registered design rights for 3%. A chart showing estimated investment in
each of the five types of IPR is presented below in Figure 13.
Table 5: UK Market Sector Investment in Intellectual Property Rights (Nominal, £bns)
1990 1995 2000 2005 2006 2007 2008 2009 2010 2011
Investment in Patents (incl. R&D and Design) 2.9 3.3 4.3 5.1 5.2 5.8 5.9 5.8 5.9 6.3
Investment in Copyright (incl. Artistic Originals and
Software)
9.2 14.0 22.1 29.3 26.7 28.6 29.9 27.0 29.1 30.1
Investment in Registered Design (incl. Design and R&D) 1.0 1.0 1.4 1.7 1.7 1.9 1.9 1.8 1.8 1.9
Investment in Unregistered Design 5.9 6.1 8.3 10.1 10.6 11.3 11.5 11.1 11.1 11.2
Investment in Trademarks (incl. Advertising and Market
Research)
4.8 6.7 10.2 11.7 12.7 13.2 13.4 13.1 13.5 14.0
Total Investment in IPRs 23.8 31.1 46.3 57.8 56.9 60.6 62.5 58.9 61.4 63.5
Total Investment in Intangibles 47.9 63.9 92.1 118.1 118.6 125.5 128.3 123.3 127.6 126.8
Note to table: Investment in patents estimated as 38% of investment in scientific R&D plus 2% of investment in design.
Investment in copyright estimated as 100% of investment in artistic originals and software. Investment in registered design
estimated as 11% of investment in design plus 3% of investment in scientific R&D. Investment in unregistered design
estimated at 87% of investment in design, that is, the remainder of design investment not allocated to patents or registered
design. Investment in trademarks estimated as 100% of investment in advertising and market research.
30
Estimating UK investment in intangible assets and Intellectual Property Rights
Figure 13. Total Investment in assets by IP coverage, Nominal £bns
Source: Own estimates, see note to Table 5.
In this report we have presented nominal measures of investment in intangible assets, and on
intangible assets protected by formal IPRs. Real, or volume, measures would require deflating
these estimates with an appropriate price index. In this context it is worth saying something about
real investment in R&D and therefore patented R&D. Here our estimate for investment in patented
R&D is £6.4bn in 2011, having risen from £2.9bn in 1990. The average rate of growth in nominal
patented R&D, over the period 1990 to 2011, is 3.7%. Applying an output price index such as a
GDP deflator, as is typical for R&D, rising at a rate of approximately 3 to 4% p.a., would imply that
there has been almost no rise in real R&D investment. However, recent studies suggest that the
implicit price of R&D may have been falling rapidly due to technological innovation in the R&D
upstream sector (Corrado, Goodridge and Haskel (2011)). Those authors estimate the price of R&D
in the UK to have fallen at an average rate of approximately -7.5% p.a. over the period 1985 to
2005. Applying this price index would therefore imply that real patented R&D investment has grown
at a rate of approximately 11% p.a. over the period considered here.

Estimating UK investment in intangible assets and Intellectual Property Rights
31
5. Conclusions
Applying the intangibles framework, as used in the NESTA Innovation Index, we find that total
UK market sector investment in intangible assets reached £126.8bn in 2011, compared
to £88bn of investment in tangible assets. We also note that since the recession of 2008-9,
intangible investment has recovered and grew in 2010-11. In contrast investment in tangible
assets has fallen. Of the £126.8bn invested in intangibles in 2011, we estimate that approximately
half (£63.5bn) was investment protected by formal IPRs (patents, copyright, registered design
rights, unregistered design rights or trademarks). Of investment protected by IPRs, the largest
component is investment in copyright, which stood at £30.1bn in 2011. Investment in
unregistered design rights and trademarks were £11.2bn and £14bn respectively in 2011,
investment in patents, £6.3bn, and investment in registered design rights, £1.9bn.
In forming these estimates we first identify investment in each intangible asset, as set out in
Corrado, Hulten et al. (2005). We then form estimates of how much investment in each asset
type is formally protected by IPRs. In doing so, we allow for the fact that both scientific R&D
and Architectural and Engineering Design can be protected by either patents or registered
design rights. We estimate that 38% of investment in scientific R&D is protected by patents and
3% by registered design rights. We also estimate that 11% of investment in Design is protected
by registered design rights and 2% by patents. The remainder of investment in Design is
assumed to be protected by unregistered design rights. We further assume that 100% of
investment in Artistic Originals and Software is protected by copyright, and that 100% of
investment in Advertising and Market Research is protected by Trademarks.
We emphasise that this work estimates investment in knowledge assets and the proportions of
that investment protected by formal IPRs. We take no stand on whether investment in knowledge
assets is higher or lower than it would have been were those assets not protected by IPRs. That
area requires further work. Whilst some evidence suggests that the ability to use IPRs increases
investment in innovation through the incentive of monopolist revenues, others suggest that the
same mechanism reduces innovation by removing the incentive to continually innovate.
Nevertheless, the scale of investment in IPR-protected assets is not fully appreciated. Investment
in IPRs is higher than that in commercial buildings and also higher than plant & machinery
(including ICT) and vehicles combined. The role of assets protected by IPRs, as drivers of
growth, deserve greater consideration in both measurement and policy.

32
Estimating UK investment in intangible assets and Intellectual Property Rights
References
Arundel, A. (2001). “The relative effectiveness of patents and secrecy for appropriation.”
Research Policy 30(4): 611-624.
Awano, G., M. Franklin, et al. (2010a). “Measuring investment in intangible assets in the UK:
results from a new survey.” Economic and Labour Market Review 4(7): 66-71.
Chamberlin, G., T. Clayton, et al. (2007). “New measures of UK private sector software
investment.” Economic and Labour Market Review 1(5): 17-28.
Cohen, W. M., R. R. Nelson, et al. (2000). Protecting their intellectual assets: Appropriability
conditions and why US manufacturing firms patent (or not), National Bureau of Economic
Research.
Corrado, C., P. Goodridge, et al. (2011). “Constructing a Price Deflator for R&D: Calculating the
Price of Knowledge Investments as a Residual.”
Corrado, C., C. Hulten, et al. (2005). Measuring capital and technology: an expanded framework.
C. Hulten, University of Chicago Press.
Farooqui, S., P. Goodridge, et al. (2011). “The Role of Intellectual Property Rights in the UK
Market Sector.”
Galindo-Rueda, F., J. Haskel, et al. (2008). How much does the UK employ, spend and invest
in design, CeRiBA Working paper, April.
Goodridge, P. and J. Haskel (2011). Film, Television & Radio, Books, Music and Art: UK
Investment in Artistic Originals, CERIBA working paper.
Goodridge, P., J. Haskel, et al. (2012). “Updating the value of UK copyright investment.”
Goodridge, P., J. Haskel, et al. (2012). “UK Innovation Index: productivity and growth in UK
industries.”
Haskel, J. and A. Pesole (2010). Productivity and Innovation in UK Financial Services: An
Intangible Assets Approach.
Haskel, J. and A. Pesole (2011). “Design services, design rights and design life-lengths in the
UK.”
OfficeforNationalStatistics “Annual Survey of Hours and Earnings, 1997-2011: Secure Data
Service Access [computer file]. Colchester, Essex: UK Data Archive [distributor], April 2013.
SN:6689.”

Estimating UK investment in intangible assets and Intellectual Property Rights
33
OfficeforNationalStatistics “National Employers Skills Survey: Secure Data Service Access
[computer file]. Colchester, Essex: UK Data Archive [distributor], June 2011. SN:6705.”
OfficeforNationalStatistics “UK Innovation Survey: Secure Data Service Access [computer file].
Colchester, Essex: UK Data Archive [distributor], August 2013. SN:6699.”
ONS (1998). “National Accounts: Concepts, Sources and Methods.”
ONS (2014). “Multi-factor Productivity, Indicative Estimates to 2012.”
34
Estimating UK investment in intangible assets and Intellectual Property Rights
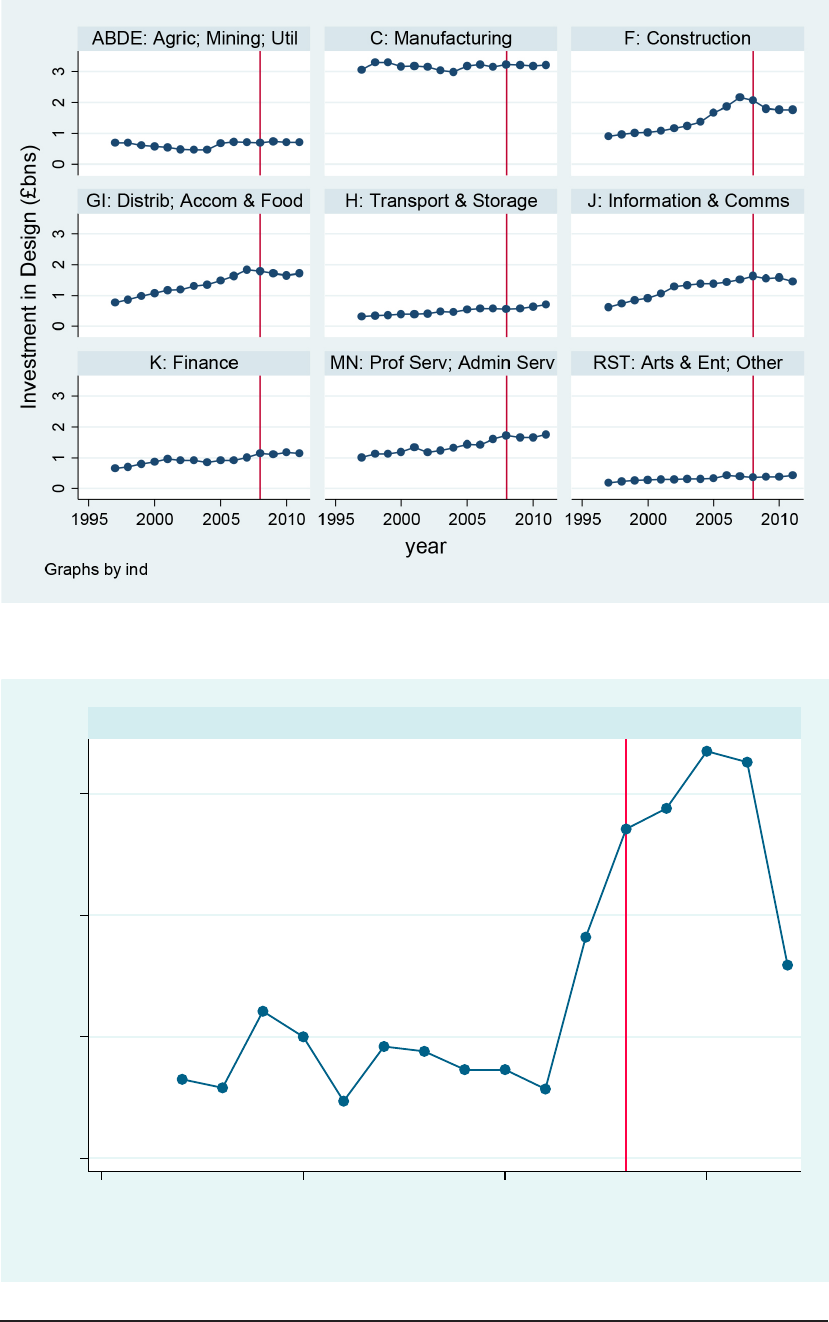
Appendix 1: Industry-level
Intangible Investment
This appendix presents data for nominal intangible investment at the industry level, based on a
nine industry breakdown. The following charts present industry data for each intangible asset.
Where relevant, estimates of own-account and purchased estimates have been summed for
that category. Estimates for advertising and market research have also been summed to form
the asset category ‘Branding’. In each chart the line at 2008 marks the start of the recent
recession.
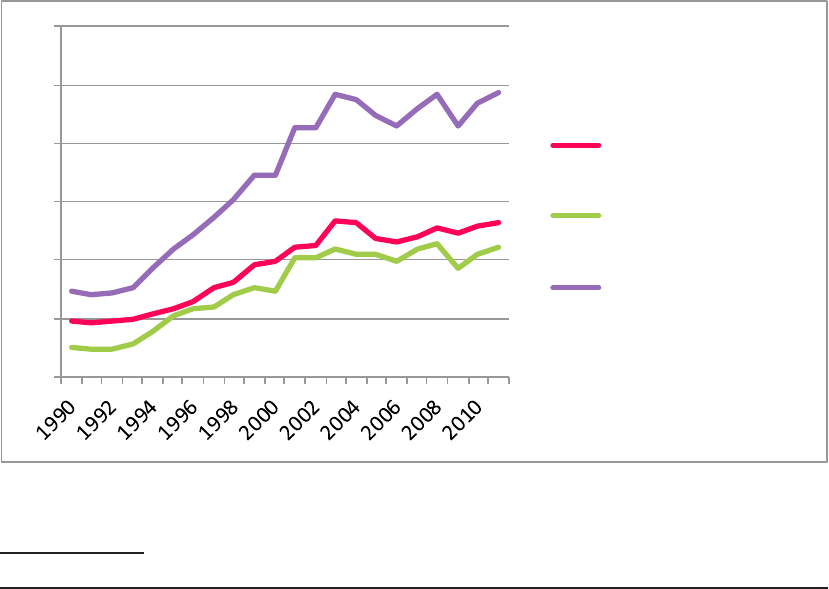
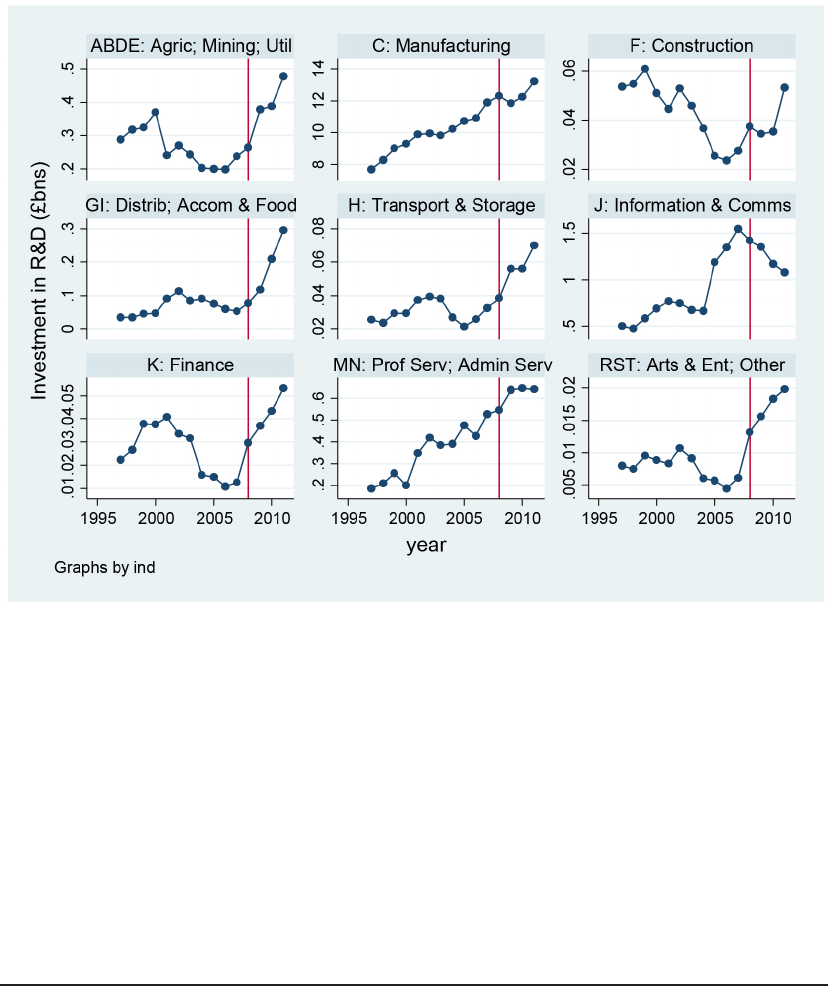
Figure A1.1: Industry-level investment in R&D
Note to figure: Y-axes for each chart have different scales
Estimating UK investment in intangible assets and Intellectual Property Rights
35
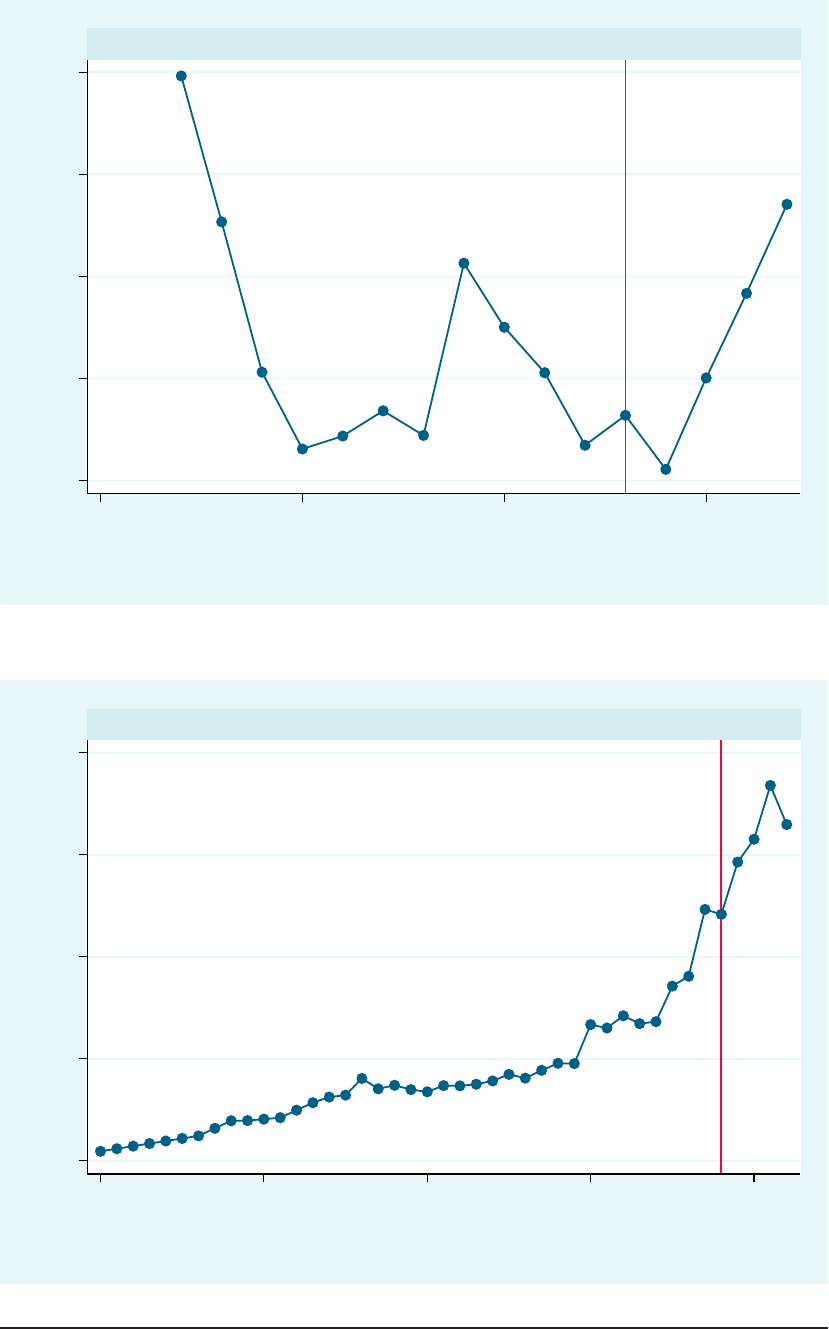
Figure A1.2: Industry-level investment in Mineral Exploration
.4 .6
.8
1 1.2
1995 2000 2005 2010
ABDE: Agric; Mining; Util
Investment in Mineral Exploration (£bns)
year
Graphs by indh1
Figure A1.3: Industry-level investment in Financial Product Innovation
0 .5 1 1.5 2
1970 1980 1990 2000 2010
K: Finance
Investment in Financial Product Innovation (£bns)
year
Graphs by indh1
36
Estimating UK investment in intangible assets and Intellectual Property Rights
Figure A1.4: Industry-level investment in Design
Figure A1.5: Industry-level investment in Non-scientific R&D
.2 .4 .6 .8
1995 2000 2005 2010
MN: Prof Serv; Admin Serv
Investment in Non-scientific R&D (£bns)
year
Graphs by indh1
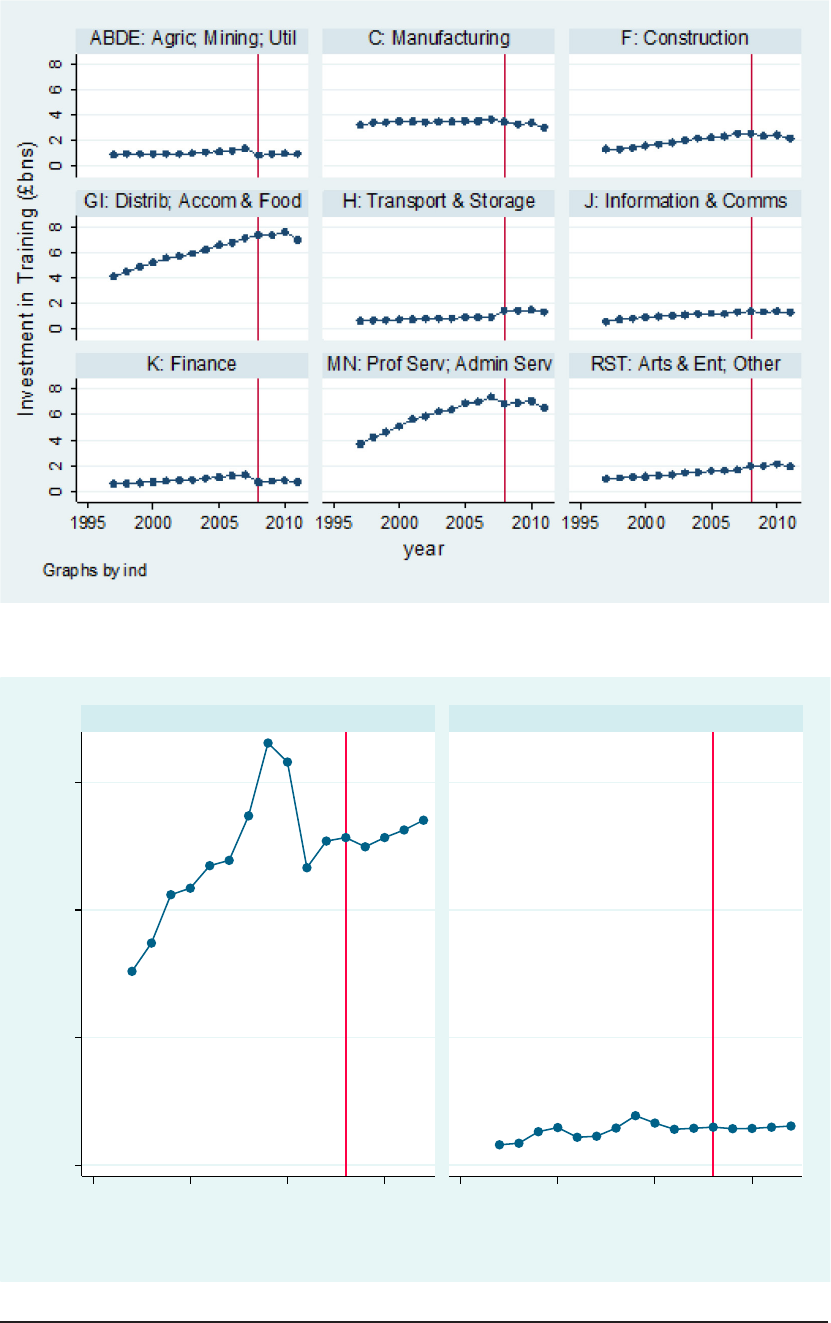
Estimating UK investment in intangible assets and Intellectual Property Rights
37
Figure A1.6: Industry-level investment in Training
Figure A1.7: Industry-level investment in Artistic Originals
0 2 4 6
1995 2000 2005 2010 1995 2000 2005 2010
J: Information & Comms RST: Arts & Ent; Other
Investment in Artistic Originals (£bns)
year
Graphs by indh1
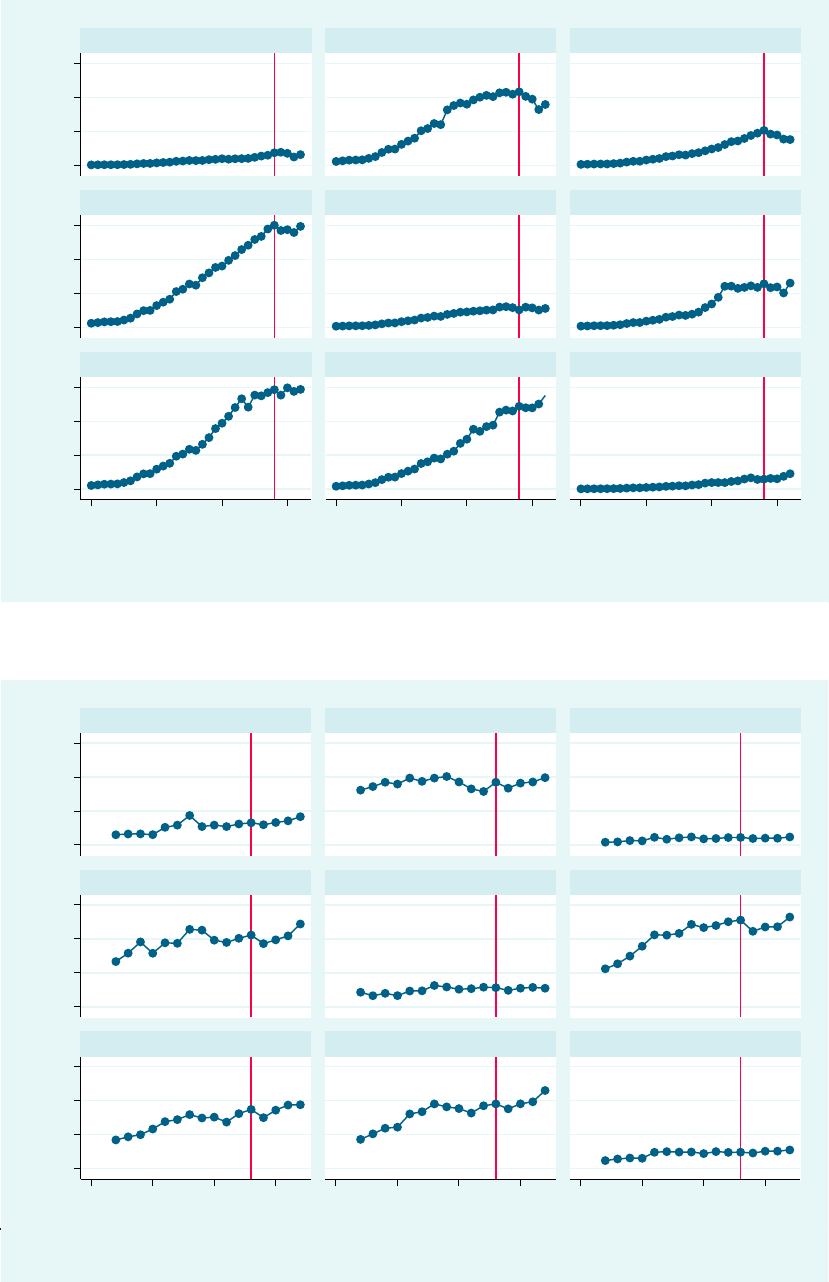
38
Estimating UK investment in intangible assets and Intellectual Property Rights
Investment in Software (£bns)
0 2 4 6 0 2 4 6 0 2 4 6
ABDE: Agric; Mining; Util C: Manufacturing F: Construction
GI: Distrib; Accom & Food H: Transport & Storage J: Information & Comms
K: Finance MN: Prof Serv; Admin Serv RST: Arts & Ent; Other
1995 2000 2005 2010 1995 2000 2005 2010 1995 2000 2005 2010
year
Graphs by indh1
0 2 4
6
0 2
4
60 2 4 6
1980 1990 2000 2010 1980 1990 2000 2010 1980 1990 2000 2010
ABDE: Agric; Mining; Util C: Manufacturing F: Construction
GI: Distrib; Accom & Food H: Transport & Storage J: Information & Comms
K: Finance MN: Prof Serv; Admin Serv RST: Arts & Ent; Other
Investment in Organisational Processes (£bns)
year
Graphs by indh1
Figure A1.9: Industry-level investment in Software
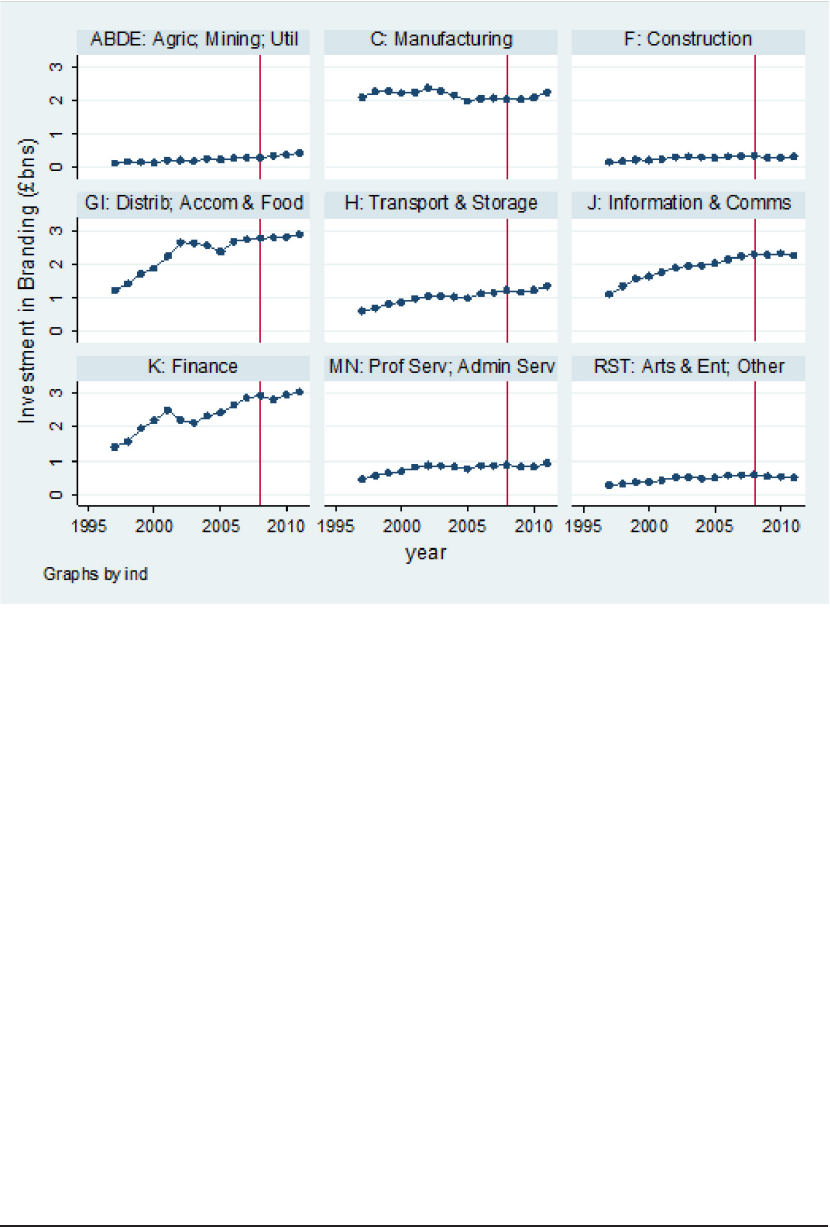
Estimating UK investment in intangible assets and Intellectual Property Rights
39
Figure A1.10: Industry-level investment in Branding
Data in the above charts, for 1997 to 2011, are summarised below in Table A1.1.
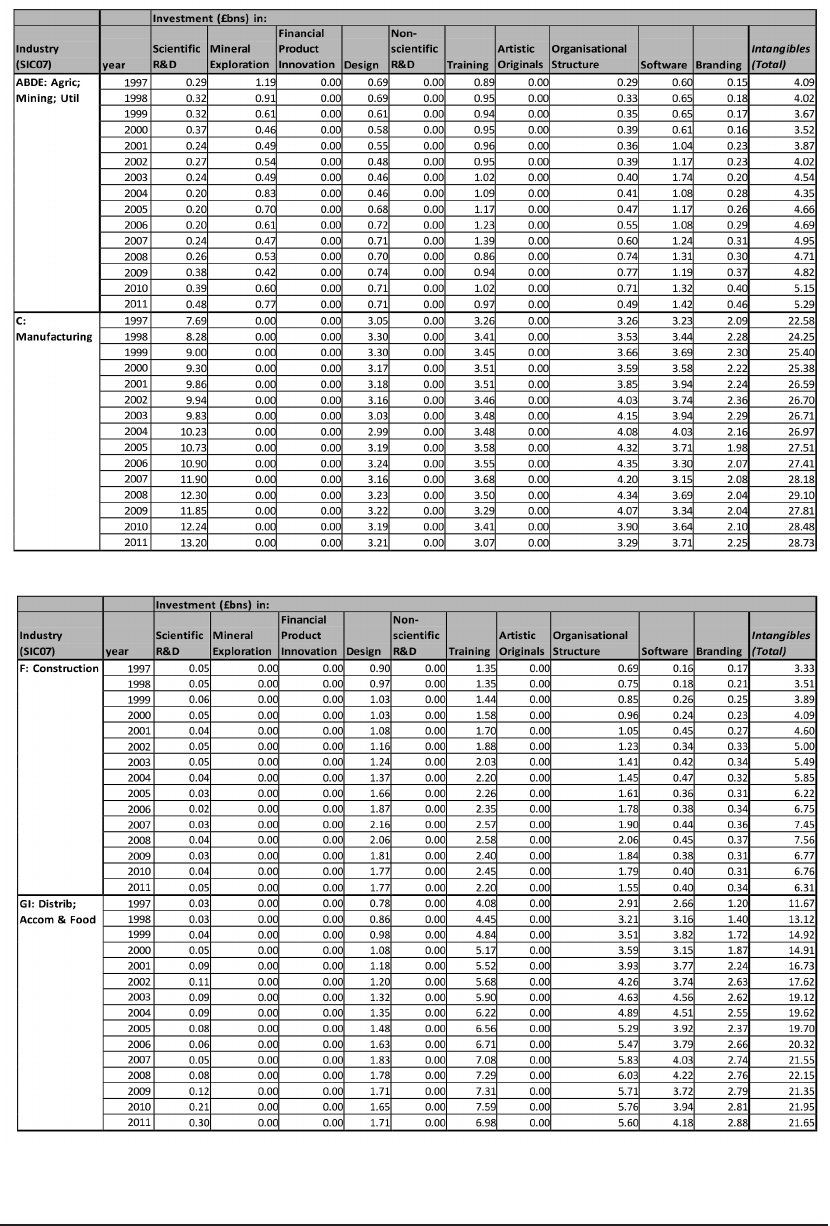
40
Estimating UK investment in intangible assets and Intellectual Property Rights
Table A1.1: Intangible investment by asset, industry and year, Nominal £bns
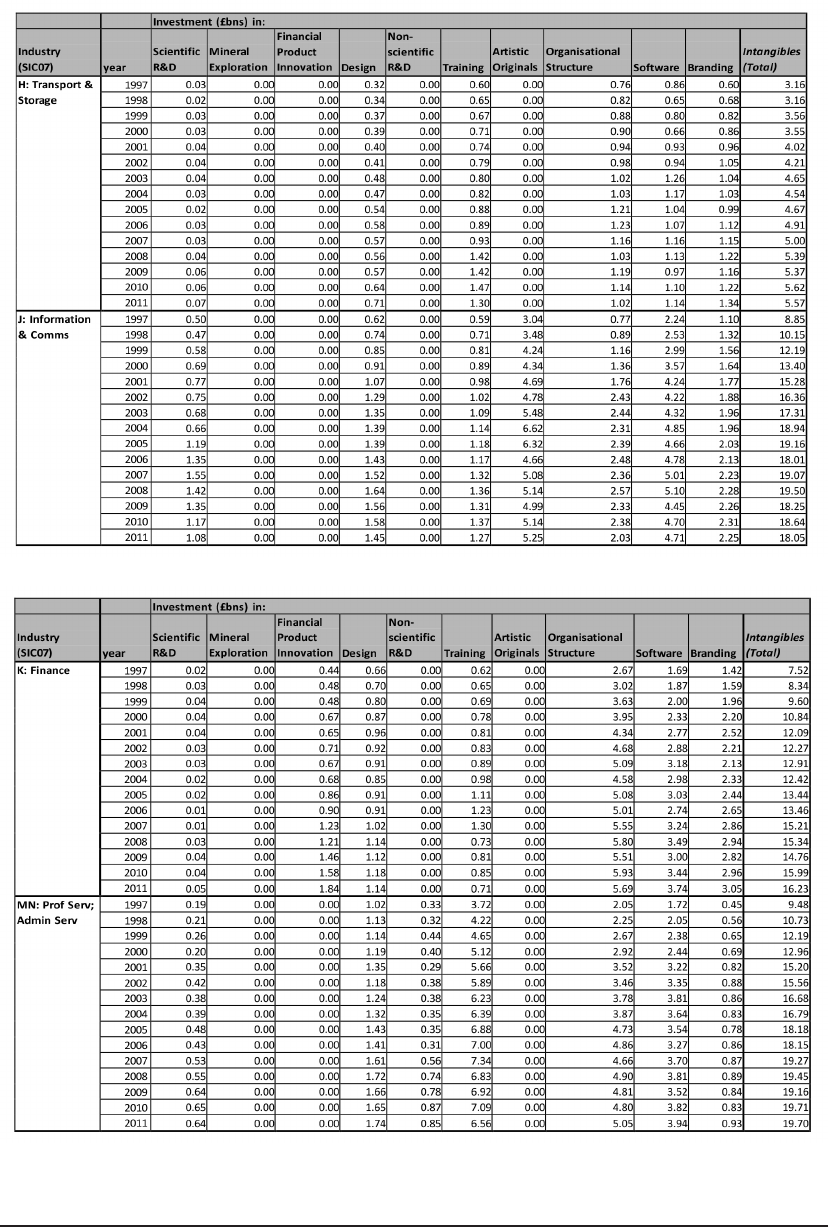
Estimating UK investment in intangible assets and Intellectual Property Rights
41
Table A1.1: Intangible investment by asset, industry and year, Nominal £bns

42
Estimating UK investment in intangible assets and Intellectual Property Rights
Table A1.1: Intangible investment by asset, industry and year, Nominal £bns

Concept House
Cardiff Road
Newport
NP10 8QQ
Tel: 0300 300 2000
Fax: 01633 817 777
For copies in alternative formats please
contact our Information Centre.
When you no longer need this booklet,
please recycle it.
DPS/IP Research-02/14
